
Want to outperform the market? Freewyld Foundry’s Revenue & Pricing Management service is driving an 18% performance lift for $1M+ STR operators, even in down markets. If you’re managing 15+ listings and want a free pricing audit, apply here
Most STR operators spend 3+ hours every month updating revenue projections in spreadsheets. They look at last year’s numbers, add a growth percentage, and hope for the best. Then they miss their targets by 20-30% because they ignored market shifts, booking momentum, and seasonal context.
In this episode, Jasper Ribbers builds a complete revenue projection system from scratch in under 60 minutes. He demonstrates three complementary methods (historical performance, market seasonality, and forward-looking bookings), then shows how Claude AI automates the entire process. What used to take hours now takes 10-15 minutes, and it updates automatically every week with new booking data.
If you manage 15+ listings and want to stop guessing about revenue, this episode gives you the exact framework and tools to build projections you can actually trust.
You’ll learn:
- Why historical data alone is the weakest projection method (and what to combine it with)
- How to use market seasonality to extrapolate annual potential from 3-6 months of data
- The “unbooked potential” method that works even for brand new units
- Why your PMS “potential revenue” number is 25-30% too optimistic
- How to account for price decay and realistic occupancy in forward projections
We also talk about:
- The three PriceLabs reports you need to pull for accurate projections
- How Claude AI retains context and becomes a persistent analytical team member
- Why dividing monthly revenue by seasonal percentage reveals portfolio health faster than raw numbers
- The data anomalies that skew projections (owner stays, maintenance, market events)
- How to update projections weekly without starting from scratch
Mentioned in the Episode:
- PriceLabs (revenue data and market analysis)
- Claude AI (projection automation)
- Whisper (voice-to-text tool for faster AI prompting)
- Build Your STR Revenue Projection System in 60 Minutes (Workshop)
- Dynamic Pricing Airbnb: How It Works, Tools Compared, and Why It’s Not Enough
- The STR Pacing Playbook
Subscribe for more episodes every week on YouTube, Spotify, and Apple Podcasts.

The STR Pacing Playbook
A step-by-step guide to tracking and using pacing data to optimize your short-term rental pricing strategy.
Download Free GuideContinue Listening

25% YoY Growth and 1.4M Travel Points From His Mortgage: David Dodge on Building a STR Portfolio
David Dodge started with one beach house in Lincoln City, Oregon in 2021. Three years later his portfolio is up 25% year over year and he's earning 1.4 million travel points annually from his mortgage payments using BILT. He and Jasper break down exactly how both happened.

June STR Market Update: World Cup Impact and New Airbnb Discounts
The June market report is here. Freewyld's portfolios closed the month up 22.36% year over year, $14.4M in revenue across 75+ client properties, while the overall market averaged 9%. Jasper breaks down the gap market by market, covers what's coming in July, and explains a new Airbnb discount that just quietly launched.
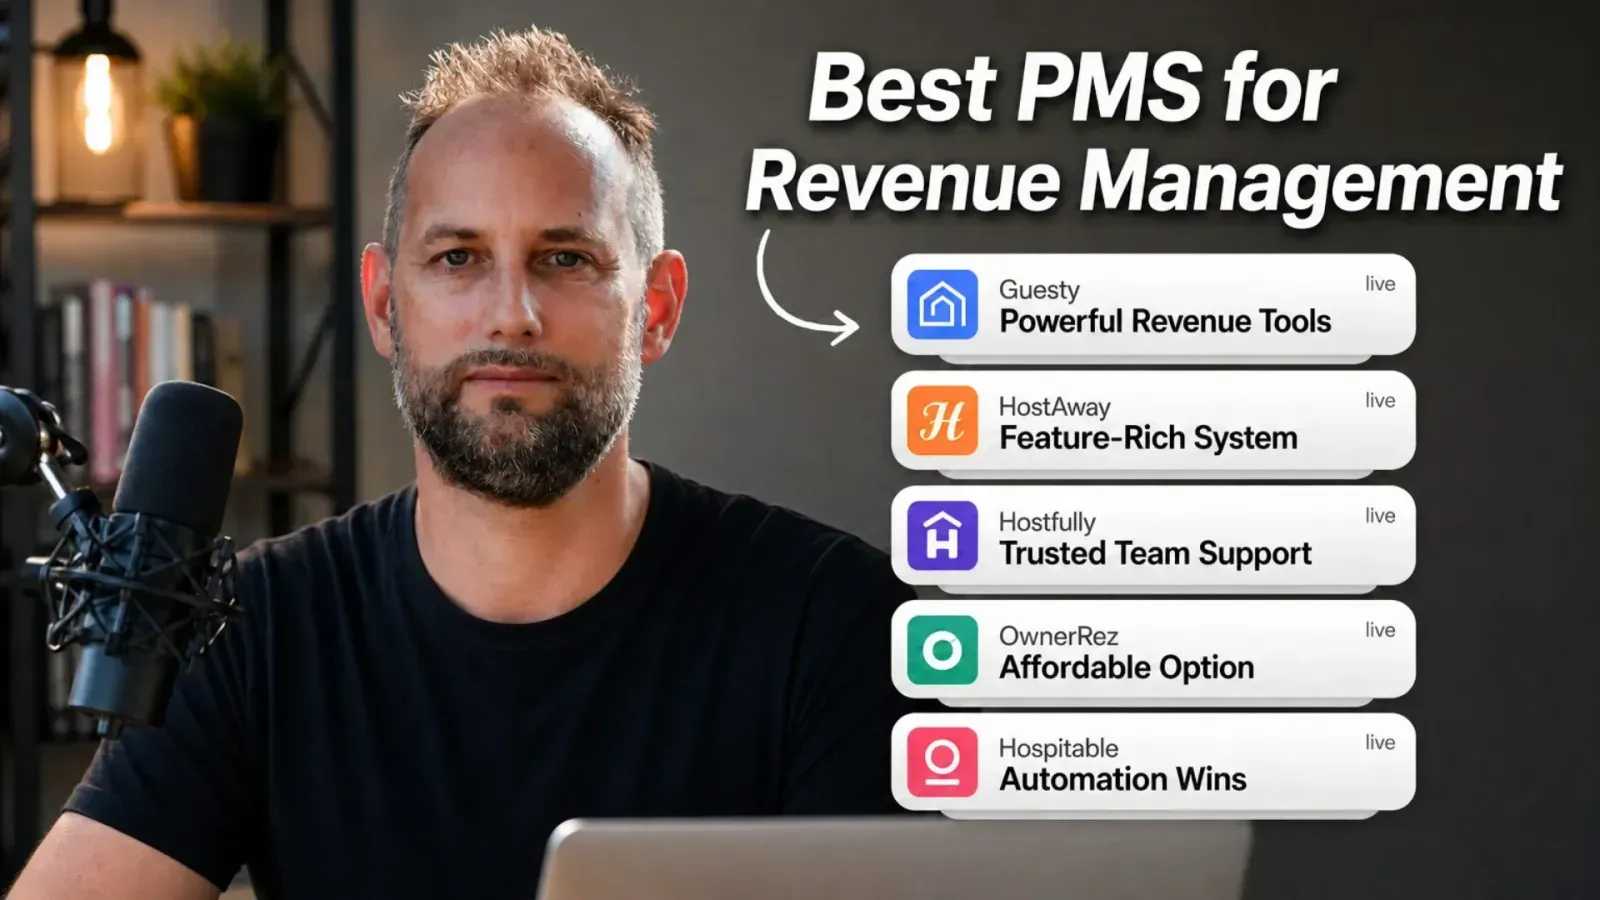
Best PMS Systems for STR Revenue Management
Jasper Ribbers manages revenue for 75+ STR companies and has worked inside nearly every PMS on the market. In this solo RevUp episode, he ranks the five systems Freewyld Foundry recommends, explains the criteria that matter most for revenue management, and covers the features that can limit your performance if you choose the wrong system.
Introduction: Why Revenue Projections Matter (And How AI Makes Them
Actually Useful)
Jasper: I was kind of blown away by the power of Claude when I first started using it a couple months ago. I spent three hours and I built an entire web app to calculate market penetration index for a portfolio. So I'm going to do a part two. In part two, I'm going to share my screen and I'm actually going to build this tool from scratch in 60 minutes or less.
Setting Up Your Data Sources
Jasper: All right. So I am going to be sharing my screen here. And I have three things open. I have a blank Google Sheet document open. Then I also have our Pricelabs account, the Freewyld Pricelabs account open. And I have Claude open as well. So those are really the only three things that I need to make all these projections.
So the first thing I'm going to do is inside my Pricelabs, I'm going to go to KPIs and historical reports. I'm going to select all listings and I'm going to scroll down a little bit to where it says trends. I'm going to go all the way to the right. Click on the three little dots and I'm going to download charts data.csv.
Once I have that, I'm going to open it up. And here you can find all the old historic data on your portfolio. So you can see the months. You can see the number of days that were booked. The number of bookable dates. You can see how many days got booked. You can see your revenue. You can see your RevPAR, ADR. So it's basically a historic overview of the performance of your entire portfolio.
Now this revenue that you see here, this is rental revenue only. So it doesn't include cleaning fees. OTA commission is not taken out. No taxes. Nothing else. It's just the nightly rate that your guest is paying. Nothing else is included in that number.
Method 1: Historical Performance Projections
Jasper: And so what we're going to do is let's say we want to project revenue for the next 12 months. And we're in April right now. So let's say we want to start with May. So we want to project May 2026 through April 2027. And we're going to use historic data. So we want to use May 2025 as an indicator for what we expect to make in May 2026 and so forth.
So we're going to select this range here. May 2025 through April 2026. Just to say that correctly. No. Let's just project April through March 2027 because then we have a full month of data. We don't have April 2026 yet. So we can't really predict 2027 April. So let's do April through March 2027. So we'll select that date range and we're simply going to copy that into our Google Sheet. Very simple.
We're going to delete the data that we don't need as of right now. If you want to predict ADR and RevPAR and Occupancy, you can totally do that. The method is exactly the same. But just for simplicity, we're going to stick with the rental revenue right now.
So here's essentially this is the T minus 12 revenue for the portfolio. Now we can sum this to get the total. So we're looking at a total of $284,000. And what we're going to do now is we're just going to simply use this as a prediction for 2026 into 2027. So this is 2025, 2026. Now we can set prediction. And very simple. We just say we expect that we're going to be making the same as last year.
Obviously, this is the easiest, most simple way to predict revenue. We're just saying, hey, we think we're going to make the same as last year. But we can make it a little bit more sophisticated by adding a modifier.
Adding Growth Modifiers to Historical Data
Jasper: So let's say that we believe that we're going to be making a little bit more or it could be a little bit less too, depending on what the market's doing. But typically, we'd be shooting for a little bit more than last year. And so let's just say that we think that we're going to do 5% more than last year, right? Then we could simply modify and change the formula.
All right. So now I am basically multiplying last year's revenue by one plus the additional percent that I think we can grow. And that will give us the new prediction, right? So here I'm just saying, hey, we're just taking whatever last year was and we think we could do 5% better. Obviously, you can change this. You can make this 10%. You can make it whatever you want. But that gives you a very basic prediction.
But if all units were active last year and if the market hasn't changed a lot, then this is probably a pretty reasonable prediction. You can also just, of course, set this to zero. You can also say, hey, you know what? I think August last year we didn't do so great. So I think maybe in August we could do 5% better. I think maybe our December wasn't great. Maybe we could do 10% better in December. But then our Thanksgiving really crushed it. So I'm going to put a minus 5 for November.
So you can play around with this. And this is the first very simple, very easy way to get predictions, right? So I'll call this tab based on historic.
Method 2: Using Market Seasonality When You Have Limited Data
Jasper: All right. So the second method to predict revenue is what I call based on recent performance. And what I'm going to do here is I'm going to assume that we don't have 12 months of historic data. I'm going to assume that we only have six months of historic data.
So I'm going to paste October through March in here. And then I'm also going to assume that these numbers are a little bit lower. I'm going to basically pretend that we started managing these units in October of last year. Now, typically the first month you're not going to see as much revenue. And then the second month you're not going to see as much either. And then it kind of ramps up to full potential.
So I'm just going to lower the numbers a little bit for the first three months here. And then the last three months I'll keep it as is. Typically it takes about three to six months for units to be close to the full potential. Obviously you need to build up some reviews. You need to get some feedback on the units, make some improvements. But after three to six months you should be pretty close to the full potential.
So yeah, so I've lowered the amounts a little bit for October, November, December. And now what I'm going to do is I'm actually going to use seasonality to predict the upcoming 12 months. So this is now our baseline. And we basically want to predict the next 12 months. So starting in April all the way through March 2027.
But for April, how do we predict April if we don't have any data from last year? That's what I'm going to show you right now.
Extracting Seasonality from Market Data
Jasper: And what I'm going to do is I'm going to go to Price Labs. I'm going to go to the market dashboard because I'm going to use seasonality to do this. So I'm going to download this market summary CSV here. I'm going to open that up. So here you find data about your market. And this is based on whatever comp set you select here. So right now I have Airbnb selected. You can create other comp sets if you want.
Again, for the simplicity of this workshop here, I'm just going to use the Airbnb data. But here you have all sorts of KPIs, right? You can see booking window, RevPAR revenue, even split out over different bedroom types. And so I'm going to use this data as an indication of seasonality.
All right. So what I'm going to do is I just need a full year of data. And so I'm just going to use 2025 as my seasonality indicator. So I'm going to copy over that data to our Google sheet here. So I'll just put markets here so it's clear that we are looking at the markets.
I think the best one to use is probably RevPAR aggregate as an indication. You can get fancy and split this up by bedroom type as well. But for this exercise, I'm just going to use the aggregate RevPAR as our indication of seasonality. Then what I'm going to do is I'm going to sum up the RevPAR here. So we have 1290 in total.
And then I'm going to divide each month by the total. I'm going to set that as a percentage. I'm going to lock this cell L23 here so that it's not going to move. And then here we go. This basically is an indication of how much revenue falls into the different months. So this is seasonality essentially, right?
You can see that December is the strongest month in this market. And that's because of Christmas and New Year. And then November is the second strongest month because of Thanksgiving. And then you see the other months are pretty similar. September is a weak month in our market.
The Math Behind Seasonality Extrapolation
Jasper: So now I know how much revenue is supposed to fall into these months. So now I can use that seasonality to extrapolate the revenue that we have over the last six months. So for October we made $13,876. Right now in October typically we'll have 8.53% of revenue. So if we divide this number by 8.53%, then basically this tells us that if our portfolio was to perform as it did in October, then we would be making $162,000 on a yearly basis.
Now we're going to do the same for November. So we can simply drag this down because in the table here, November is right below October. And then we're going to do the same for December as well. And so you see that in November our performance improved quite a bit relatively. I mean, we almost doubled the revenue, but because November is a much better month, if we extrapolate it, then the yearly projection for the portfolio didn't quite go up as much as the revenue itself. Because there is a larger part of the revenue is supposed to fall into November, right?
You see here December we improved a little bit. And then January should be a lot higher because January is the first month where I didn't take out any revenue. So when we divide January over what's supposed to fall into January, we get a higher number. Now we get some good estimates here because if you look at these numbers, the yearly, you can see the first three months were ramping up. And then we hit almost $300,000 of potential yearly revenue in January. And then February was pretty much the same. March went down a little bit.
So that tells me that, you know, relative to the market, we did really well in January and February. And then March, we performed a little bit less, not as good as in January and February.
Applying Seasonality to Create Forward Projections
Jasper: So now we can use these numbers to create an estimate of all the different months, right? So the way I would do this, I would say, okay, well, you know, January, February, March are really the best indication of what the potential of our portfolio is. Because the first three months were ramping up. So I'm going to predict, I'm going to take the average of these three months. And I'm going to predict that 280 will be our prediction for the year.
Now, how do I use that to predict the next 12 months? Well, same thing. I'm just going to use the seasonality. So for April, I am going to multiply the percentage times what we think we can do on a yearly basis. And I can do that exact same, apply that same concept to all the other months. And so what we'll see is that we get our projections for the entire year.
And so that's a really good way to predict your revenue if you don't have 12 months of data available.
Adjusting for Known Anomalies
Jasper: Now, one adjustment that you could potentially make here is, you know, you can see here, we didn't do so well in March relative to the market. And I know that there's a reason why, because our team actually stayed in our own cabins one weekend in March. And that's kind of like an owner's stay, right? And we have a sort of like a friends and family or a team rate that we use for those stays. And so that revenue is a little bit lower than what we would typically get if we were rented out to just normal guests.
And so that's why our revenue in March was a little bit affected. So I would say, you know, it's probably fair to add maybe $2,000 to that number. And as you can see that that brings it up a little bit higher. So, you know, if you know that in certain months, if there was a reason for your portfolio not to perform as well, then, you know, you can make these small adjustments to really dial in your projection a little bit more, right?
So now we have a T plus 12 projection for each of the months. Again, you know, if you think that your portfolio is going to be continuing to improve, let's say you think that you could still, for every month that we're going further into the future, let's say you think that every month you could do maybe 1% better. So we could say, hey, in April, I think we will still do 1% better. And then in May, we might do 2% better than what we did based on the last couple months, right?
In the same way that we adjusted that in the last exercise, we can just multiply by 1 plus that amount. And that way we can make some small tweaks to this, right? I messed this up a little bit, but you got the point, right? So this is how we can kind of fine tune this a little bit more.
Method 3: Forward-Looking Bookings Plus Unbooked Potential
Jasper: All right. So these are the two methods that I wanted to show you guys that you can simply do using data from PriceLabs using the Excel sheet. Now let's move to the fun stuff because obviously this is a little bit of work, you know, not too bad, but it's definitely a little bit of work. But now what we're going to do is we're actually going to go to Claude and we're going to tell Claude to use these three methods and create a cool revenue prediction for us.
Now, the third method that we are going to be using is we're going to be using actual revenue that we already have on the books and the opportunity that's still available on the books as well. So we're going to do that. We go to Report Builder and we need to create a custom report. So I'm going to go and click on Create Your Own Report here. We're going to use listings as our header row. We're going to click on Create and then we're going to select months as a second header row.
And then all we need to do is we just need to select rental revenue and we need to select available and bookable dates, potential revenue and final price. OK, so once you've done that, what you'll see is that you get your units and you get the period that you select and then you get the rental revenue and how much is still available.
So if somebody was to come in and book this unit Black Mountain for the entire month of May or whatever is left in the calendar at the price that it's currently priced at in Price Labs, doesn't take into account markups on your OTAs. And this is the amount, 7,463 is the amount that we would still be able to generate.
Why This Method Works for New Properties
Jasper: So since we are projecting April 2026 through March 2027, that's the date range that we're going to select. Now, of course, this method is going to be most accurate for the next upcoming months. Right. So for April, this is going to be good data to predict April because we already have $3,500 roughly on the books and the prices that are in our calendar right now, because it's we're not far from check-in date. The prices are probably not going to change very much. It's pretty easy to make a pretty accurate prediction of how much occupancy we will get, how many extra bookings we'll get.
Obviously, further out, that's a little bit trickier. I mean, November, for example, for Black Mountain, we don't have any revenue booked yet for July, August, and then November through March as well. So there we need to rely completely on what's available in the calendar. But also those numbers, obviously, those prices are going to come down as we get closer to the check-in date. And also we can't assume that we're going to get booked at 100% occupancy.
So obviously, we need to make some estimates. And that's where Claude really comes in to help us. But this is a third way to predict revenue. And so now we really have three methods to do this. And then we can take the average of the three. We could also make a range of low to high. So there's a lot of fun things that we can do.
But first of all, we're going to save this template and just call it, I don't know, let's call it T plus 12 goals or projections, whatever you want to call it. Okay, we're going to save it. And then we're going to click on view full report. And then we are going to download this.
Introducing Claude to the Process
Jasper: All right, so we now downloaded all this data. Now we have some good data sets here to give to Claude. So now we're going to open up Claude and we're going to say, hi, Claude.
And by the way, if you want to be fast, you can download a tool called Whisper. I can't use it because I'm recording a podcast. But Whisper, and that's without the E. So it's W-H-I-S-P-R. I think it is. Anyway, Whisper is a cool little tool that you can install on your computer. And then instead of typing, you can just talk. Whenever you want to type, you could just press a button on your computer. And for the MacBook, it's the FN button all the way on the bottom left of your keypad. But for other computers, it'd probably be a different button. But anyway, that just saves you time.
But for now, I can't really do that. Maybe I can use this microphone here to do it. Let me just test that out. I want to press on, hey, Claude, I want to make revenue projections. Let me see if that worked. I don't think it worked because probably because I'm recording a podcast. So the system is probably using my microphone for the podcast, right?
So I'm just going to be typing here. So I'm going to say, hey, Claude. I'm going to say, I want to make revenue projections for our STR portfolio in Idyllwild, California. We have four cabins and I want to project revenue for April, 2026 to March, 2027.
Critical Claude Prompting Strategy
Jasper: And then what I always do when I use Claude is I always tell it not to build anything until I give the green light. Because sometimes you just give it some information, but you want to give it more. And then it starts building all the stuff. So I'm always saying don't start building until I give the green light. So that's the first thing I'm going to tell it.
And it's going to think a little bit and it's, you know, it's going to say something back to you, which I'm probably mostly going to just ignore. It's going to ask me all these questions, which you can go through this. I just X out of it and I'm just going to tell it what we're going to use.
Okay. So I'm going to say, I will tell you how to do this and give you data to use. Okay. Claude understands and it's not going to do all this stuff that you don't want it to do. It's just going to, you really want to get it to just hold his horses until you give the final go.
All right. So I'm going to tell it that I'm going to give it three different methods. I'm going to give you three different methods. Okay. One is historic data of the portfolio. Two is using seasonality to predict revenue. And three is using revenue on the books plus unbooked potential. Okay. So now it understands the three methods. It's going to think about it and it's not going to do anything yet.
Uploading Historical Data to Claude
Jasper: So now what I'm going to do is I'm going to give it historical data. All right. So I'm going to say first, here's historical data of the portfolio. And then I'm going to say revenue. The first thing I'm going to give it is I'm going to give it the charts data, right? This is the historic revenue. And this is going to, I'm just going to toss it in there and see if it understands.
Usually when you upload a file into Claude, it's going to analyze it. And usually it will find what it's looking for. Sometimes you have to tell it, hey, look at this column. We're looking at that column, but let's see what it comes up with. It's going through the data right now. And let me just open it up real quick so that we can see. So this is the file here that I gave it. So it does have all the historic revenue data. So let's see if it can make sense of that.
All right. So here's what it's seeing. Coverage January 2022 through March 2027, which is nice. We have portfolio level, all four properties combined. A few things to flag before you continue. 2023 has a big gap. That's right. We were doing renovations. 2024 is the first clean full year. 2025 is the best prior year comparable, full 12 months. And April through June 26, we have some bookings and zeros from July onwards, right? So it did a pretty good job of analyzing this data.
However, this is just for the portfolio. And we would like it to make projections on the unit level. So I am also going to give it historic revenue data based on the unit level. And so where you can find that inside Price Labs is you go back to portfolio analytics, KPIs, and historic reports. And then you scroll all the way down. And you want to look for the section where it says listing performance. And then again, you're going to click the three dots and download all month CSV.
Unit-Level Data and Additional Context
Jasper: Now what you're going to get is you're going to get the same data, but now it's listed on a unit level. So that's really nice. So now we're going to tell Claude, hey, here's the same data, but on a unit level. Technically, we didn't really need that first one, actually. Now that I think of it, because we do want to project revenue on the unit level, which also will give us the total, of course. But let's see what Claude makes of this. It's going to think for a while.
Okay. So now we got his reaction here. So observations, cabin, we got juniper, black mountain, lodgepole pine, ursus, consistent performer, a couple notes. All right. So this is really good.
Now, one thing that I want to point out as well is if you want to use your own data to predict revenue for new units that you might want to onboard, what you can do as well is you can download on the same screen here, the KPIs and historical reports. You can also download select stay date range. And what that gives you is the bedroom count and a few other things, a few other metrics as well. But most importantly, this has the bedroom count.
And so if you want to at some point use Claude, let's say you want to onboard a new three bedroom unit. If you upload this data, then Claude knows how many bedrooms each of your unit has. And then you can tell it, hey, use my three bedrooms as a predictor to predict revenue for this new unit. Here's a few differences. It has a hot tub. It has this, has that, blah, blah, blah. So that way you can really use Claude to make projections for new units as well.
Building Context for Future Use
Jasper: So I'm just going to upload it. I'm just going to say here you can find the bedroom count of the units. And what's great about Claude is that this is now a chat that I have and I can always refer back to this chat. And Claude will remember anything that we talked about in this chat. Claude will remember that and be able to use it in the future.
So anything I need in the future around our cabins, like a report on revenue or projections or whatever I need, I can just go back to this chat and have Claude do any type of calculations or any type of work since it already knows the data now. Right. So it will remember that.
Another thing you could do is you could also upload the descriptions of the Airbnb listings because that has a lot of details about the units. What's available. So, you know, amenities, whatnot. You can upload reviews. You know, you can give Claude as much information as you want and that will just help it understand the units better. You know, you can do so many different things with it. Right. You can have it create an overview of reviews and overview of the most important feedback that you've gotten.
So there's so much that you can do with Claude, which is why it's such a great tool. But yeah, now it understands the bedroom counts. So that's cool.
Adding Market Seasonality Data
Jasper: All right. So now we have given it some data. We're going to give it more data. The next data that we are going to give Claude is, let me think real quick. Oh yeah. Market data. I'm now going to give you market data to use so that you understand the seasonality in the market.
And of course, again, you can calculate all sorts of stuff. You can calculate how your units are performing compared to the market. You can upload comp sets as well in Price Labs. You can create all sorts of comp sets, upload the data and have it create all sorts of reports. Also very useful for your owners. If you want to show, hey, look, your unit did 30% better than the market or whatever it is.
So I'm going to give it the market data now. And I'm going to focus on the predictions using the booked revenue and the opportunity. Because the other two methods, you know, are pretty easy to do in Excel. And we've already gone through that. So it'll be easy for Claude to do that. But yeah, here's the, now it knows the market seasonality.
Claude Asks Clarifying Questions
Jasper: And now it's asking me a question. It says, one thing I want to understand. Do you want to use the market occupancies divided by ADR to set the projection targets? Or just use it to confirm seasonality shape and anchor the projections to your own actuals?
So that's a good question. So, and that's great about Claude. If it doesn't understand something or it has some doubt, it will ask you. So I'm going to tell Claude, you can use the seasonality calculated by looking at how much revenue falls into the different months in the market to extrapolate monthly revenue to yearly. And then apply seasonality to predict future months.
I always, when I explain something, I like to say, does that make sense? Because sometimes if it doesn't really understand it and you say, does it make sense? Sometimes it will actually say, hey, no, I'm not quite clear on this. But in this case, it says, yes, totally makes sense. Logic would be calculate seasonal weights, anchor to a known number, apply weights to project all months.
All right, it's explaining it a lot better than I did. And it gives an example here. And now the key question that it has, which year of market data do you want to use for the seasonal weights? Options I see 2025 only, the most recent year. Yeah, I think using recent rolling 12 months is probably the best method. So instead of use recent rolling 12.
Uploading Forward-Looking Booking Data
Jasper: Now it has all the data that it needs except for our goals report. So now I'm going to give you revenue on the books and unbooked potential, right? And that file was our T plus 12 projections. Okay, so now it's going to go through that file and tell us what it thinks.
As it's thinking, I'm already going to type. Because one thing it needs to do is it needs to predict how much our prices are going to come down for the unbooked potential. And also how much occupancy do we expect to get in that month?
Okay, so it's gone through the data. Potential revenue. So obviously now we need to explain. So the potential revenue will never be 100% realized. Because our prices will come down as we get closer to check-in date. And we typically don't reach 100% occupancy.
So in order to estimate how much of the unbooked potential we will realize, you can look at historic occupancy and make an estimate of how much prices will come down. Now obviously because we have a lot of historic data and all of our units were active, that's probably going to be the best predictor. Combining that with the revenue that we have already on the books.
Why This Method Matters for New Operators
Jasper: But this method, if you don't have a lot of data, then this method becomes very powerful. Because if you don't have a lot of data, let's say you only have one or two months of data. Or maybe you don't have any data. You're just starting out. Then this is pretty much the only way to really predict revenue. Is just looking at how much do we have on the books and the unbooked potential.
Obviously you could also look at market data. Make an estimate of, hey, what are similar units doing in the market? But outside of that, this is a good method. And what's also great about it is that you can then, every week, you can upload new bookings. And it will learn how much of the unbooked potential is realistic to project. So every week you can upload your most recent bookings. And it will fine tune the projections based on that.
Working Through Claude's Questions on Price Decay
Jasper: All right. So let's see. Now it's going to ask me two questions. Do you want to use each property historical occupancy by month? Portfolio level average? I would say probably use portfolio level average. Or actually, no. Option one is best. The first option.
And then number two. Price reduction factor by how much you typically discount as you approach check-in date. As a flat assumption across all months. Prices come down 15% on average. Does it vary by season? It varies by season. And then I'm going to say I recommend looking at historic revenue to pinpoint how much prices would have to come down to get to roughly the same numbers.
Let's see if that makes sense to him. But as you can see, it's really nice to work with Claude because it's like having a team member. It's like a person that you're talking to. And it will ask you questions. It will give you answers. And so it's nice.
Okay, before I stop, which historical data should we use for the ADR comparison, 2025 actuals. Yeah, 2025 actuals. And now I think it has pretty much all we need.
Requesting the Final Output Format
Jasper: Okay, perfect. So for output, please create a Google Sheet document with three tabs, one for each method. Then create a fourth tab called, let's call it master, where you summarize the data. Basically give T plus 12 projections for each unit. Then the sum for the portfolio. I suggest you use the average of the three methods. Also, create an overview where you see the biggest discrepancies. Does this make sense?
You better say yes. Makes total sense. Yay. Yeah, so it doesn't have a Google Sheet integration available. So it can create an Excel workbook, which we can upload to Google Drive. It's fine. And by the way, I think Claude also has an extension that you can install directly on Google Sheets. But I haven't played around with that yet. So, okay. Then I'm going to say, let's go.
Reviewing Claude's Output and Iterating
Jasper: All right. So Claude is done. Probably took about, I don't know, maybe 15 minutes or so, 10, 15 minutes to create it. So now what you can see here is some explanations. You can see the file here on the right side as well. Right? So we can see here method one historical. We can see method two seasonality, method three on the books. And then we have the master where it has an overview. And we're using the averages here.
Now you can open this in Numbers or in Excel if you have it. Or you can click on the Google Sheets icon here. And it will upload the Excel file into Google Sheets. And voila. We now have exactly what we want.
Now, as you can see, there is a gap here. I don't see any data for November 2026. So usually when you create it, when it does it for the first time, you usually see some gaps where you have to step in. So typically what I would do is I would just have a quick look through the file to see if I notice any major problems. So method one is predicting 284. Method two is also predicting the same actually. And then the other method is predicting, we don't have a total here, it seems. Do we? It doesn't seem that we have a total.
On the master sheet, we can see here, there's some key observations that you can go through and see. This could be a reason to maybe fine tune some stuff. You know, we see here that March has a high variance. And we already noticed that. I already mentioned that March was somewhat of a weak month for us because we had a big team stay.
But I'm noticing that November is missing here. And taking all methods combined, it's predicting a little bit higher. So I'm going to take a screenshot of this and send that to him and say, hey, November 2026 data is missing. Right. So I'll add the screenshot here and I'll say November 2026 data is missing.
The Power of Persistent Context
Jasper: It will look at it and it will probably fix that right away. Okay. So now it's fixed that. Actually, I think the data was there. It was just hard to read. Yeah. The data was there. It was just the column width was a bit out of whack. So you can continue to just give it feedback and make improvements. I want to keep it. I want to wrap it up now.
But yeah, as you can see, I hope you're taking away a couple of things from this episode. Number one is understanding how can you make projections, property projections. Even if you have, or portfolio or property projections, you can apply these methods to individual properties, to groups. You can apply it to the entire portfolio, however you want.
But then secondly, also how you can use Claude to do all these types of calculations. And you can even take it a step further. And as I mentioned, you can now, once you have this, you could literally upload your bookings every week, new bookings and tell Claude, hey, here's some new bookings. How does this affect our projections, right? And it will create an updated version for you.
Beyond
Related Articles

STR Market Update June 2026: World Cup Impact, Top Markets, and Airbnb's New Discounts
Freewyld Foundry's portfolios finished June up 22.36% year over year while the overall market averaged 9%. Here is where the gap came from, which markets outperformed, and what Airbnb just changed that could affect your pricing strategy.
The 5 Best PMS Systems for STR Revenue Management (Ranked)
Freewyld Foundry manages 4,000+ listings across 75+ companies worldwide and has worked inside nearly every PMS on the market. Here are the five systems we actually recommend for revenue management, and what to look for before you choose.
How to Outsource STR Revenue Management Without Wasting Time and Money
Most STR operators who outsource revenue management end up worse off than before. Here's the checklist we built after reviewing 1,000+ companies: what to have in place before you hire in-house or work with a service provider.