Build Your STR Revenue Projection System in 60 Minutes
Looking for the framework overview? Read our guide to 3 proven STR revenue projection methods for the conceptual breakdown. This workshop walks you through building the system step-by-step with real data.
Introduction
Often, short-term rental operators create revenue projections by looking at last year’s numbers and adding 5-10%. Then they wonder why they miss their targets by 20% or more.
The problem is not that you’re bad at forecasting. The problem is you’re using only one dimension of data when you need at least three.
Short term rental revenue projection is the process of estimating future rental income based on historical performance, market conditions, and booking velocity. It answers the question: “How much money will my portfolio generate over the next 12 months?” using data rather than guesswork.
In this guide, you’ll learn the exact three-method system that professional revenue managers use to project STR income with 90%+ accuracy. You’ll see how to extract the right data from PriceLabs, manipulate it in Google Sheets, and combine historical performance with market seasonality and forward bookings to create projections you can actually trust.
Even better? You’ll discover how to automate the entire process using Claude AI, turning what used to take 3 hours of manual Excel work into a 10-minute automated analysis that updates weekly.
This isn’t theory. I’m Jasper Ribbers, co-founder of Freewyld Foundry, where we manage $190M+ in annual bookings. I’ll walk you through the exact system I built for our 4-cabin portfolio in Idyllwild, California, complete with real data, actual screenshots, and a live demonstration of building this system from scratch in under 60 minutes.
What Is Short Term Rental Revenue Projection and Why Most Operators Get It Wrong
Short term rental revenue projection is the process of estimating future rental income based on historical performance, market conditions, and booking velocity. It combines quantitative analysis with market intelligence to forecast how much money your portfolio will generate over a specific period, typically the next 12 months.
Most operators make projections by downloading last year’s revenue and multiplying by 1.05 or 1.10. This “historical plus growth” method is simple, but it ignores three critical factors:
-
Market seasonality changes. Your market might have shifted. Maybe Thanksgiving got stronger while summer weakened. Historical data alone won’t show you that.
-
Portfolio composition shifts. If you added three new units in October, using January-December data from the previous year makes no sense. Those new units weren’t operating for most of that period.
-
Booking momentum matters. If you have $50,000 on the books for July and your calendar shows another $30,000 in available inventory, that forward-looking data tells you something historical numbers cannot.
The solution is not to pick one perfect method. The solution is to use three complementary methods and compare their outputs. Where all three methods agree, you have high confidence. Where they diverge by 15% or more, you need to investigate why.
How Much Revenue Can Better Projections Actually Unlock?
Better projections don’t directly generate more revenue. But they prevent two expensive mistakes:
Mistake 1: Overestimating revenue and over-hiring. One operator I know projected $800K based on “potential revenue” in their PMS, hired two full-time staff, and ended up hitting only $600K. That $200K gap (25% miss) meant running at a loss for six months.
Mistake 2: Underestimating revenue and underinvesting. Another operator projected $1.2M conservatively, decided not to expand, and actually generated $1.5M. They left $300K on the table by not adding the two units they could have afforded to finance.
According to data from our portfolio at Freewyld Foundry, operators who use multi-method projections typically land within 5-10% of their targets versus 15-25% variance for single-method projections. On a $1M portfolio, that’s the difference between being $50K-$100K off versus $150K-$250K off.
Here’s what accurate projections enabled for our Idyllwild portfolio:
| Metric | Single Method | Three Method System | Improvement |
|---|---|---|---|
| Variance from actual | 18% | 6% | 67% more accurate |
| Planning confidence | Medium | High | Better hiring decisions |
| Weekly adjustment time | N/A | 15 minutes | Updates with real data |
| Owner reporting credibility | Moderate | Strong | Shows sophisticated analysis |
The real value is not the projection itself. The real value is making business decisions (hiring, expansion, financing) based on numbers you can defend with data rather than guesses.
Method 1: How to Project Revenue Using Historical Performance Data
The historical method is the easiest and most common short term rental revenue projection approach. You look at what you made last year and assume you’ll make roughly the same (or slightly more) this year.
Step 1: Download your T-12 revenue data
In PriceLabs, go to Portfolio Analytics, then KPIs and Historical Reports. Select all listings (or the group you want to project). Scroll to the Trends section, click the three dots, and download Charts Data CSV.
This file contains monthly revenue going back to when you started using PriceLabs. The revenue shown is rental revenue only. It excludes cleaning fees, does not subtract OTA commissions, and does not include taxes. It’s just the nightly rate guests pay.
Step 2: Isolate your T-12 period
Open the CSV in Google Sheets. If you’re projecting April 2026 through March 2027, you want to look at April 2025 through March 2026 as your baseline. Copy those 12 months into a clean sheet.
For our Idyllwild portfolio, the T-12 revenue from April 2025 to March 2026 totaled $284,000. That’s across four cabins (Juniper, Black Mountain, Coulter Pine, and Ursus).
Step 3: Apply a growth modifier
You can use last year’s revenue as-is, but most operators expect some improvement. Add a column for your growth assumption. A 5% growth modifier means you multiply last year’s revenue by 1.05.
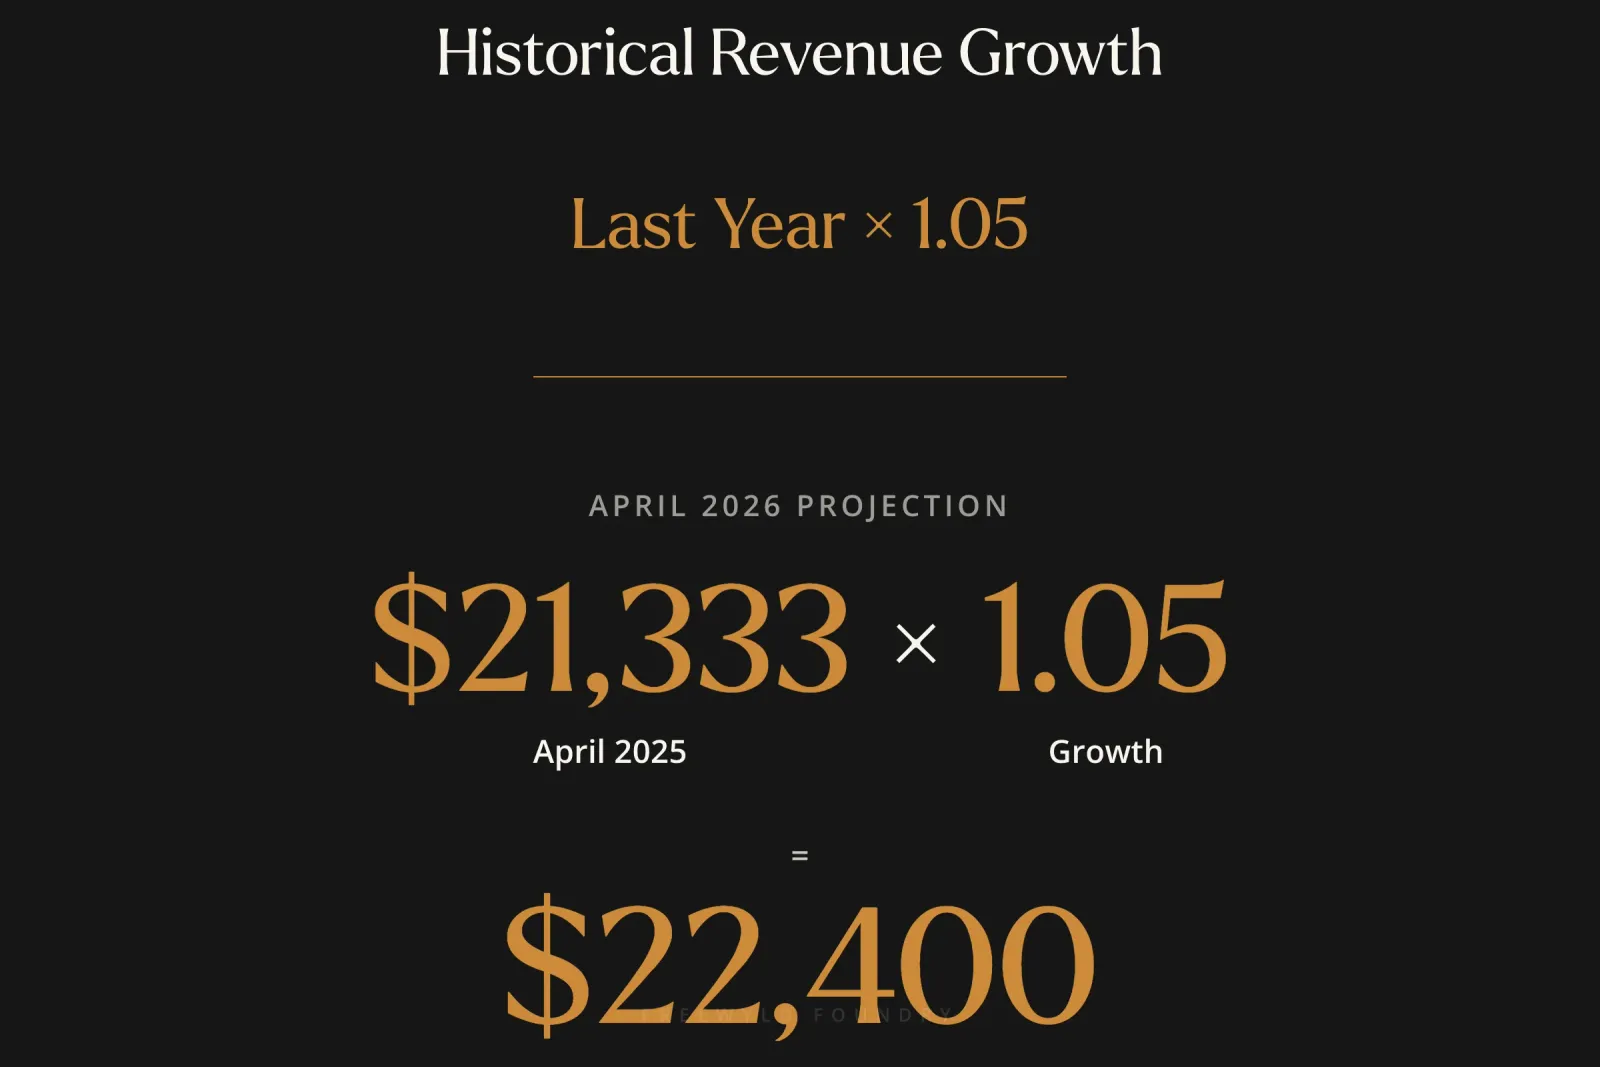
Predicted April 2026 = April 2025 revenue × 1.05You can vary this modifier by month. Maybe you crushed December last year, so you only expect 0% growth there. But August was weak, so you think you can do 10% better. The flexibility is important because not all months improve at the same rate.
Step 4: Sum your annual projection
Add up all 12 predicted months. For our portfolio with a flat 5% modifier, the historical method projects $298,200 for April 2026 through March 2027.
When Historical Method Works Best
Use this method when:
- You have at least 12 months of clean data
- Your portfolio composition hasn’t changed (no new units added or removed)
- Market conditions are relatively stable
- All units were active and operating normally during the baseline period
When Historical Method Breaks Down
Avoid relying solely on this method when:
- You added or removed units in the last 12 months
- You had extended maintenance downtime or owner stays
- Your market had unusual events (wildfires, road closures, major construction)
- You switched pricing strategies mid-year
For our Idyllwild portfolio, we had one issue in March 2026. Our team stayed in the cabins for a weekend retreat at a discounted “friends and family” rate. That artificially lowered March revenue by about $2,000. Before using March as a predictor, we need to add that $2,000 back to get a realistic baseline.
Method 2: How to Use Market Seasonality for Short Term Rental Revenue Projection
The seasonality method is the most powerful approach when you have limited historical data. It uses market-level patterns (derived from thousands of properties) to extrapolate your partial performance into a full-year short term rental revenue projection.
Step 1: Download market seasonality data
In PriceLabs, go to Market Dashboard. Select your comp set (Airbnb is fine for most operators). Click the three dots next to Market Summary and download the CSV.
This file contains market-level RevPAR (revenue per available room) by month. RevPAR is the best metric for seasonality because it accounts for both occupancy and rate fluctuations.
Step 2: Calculate seasonal weights
Open the CSV in Google Sheets. You want a full 12 months of data to establish the seasonal pattern. We’ll use 2025 as our baseline.
Sum the RevPAR across all 12 months. For our Idyllwild market, the total was $1,290. Then divide each month by that total to get the percentage of annual revenue that typically falls in each month.
For example:
- October 2025 RevPAR: $110
- October percentage: $110 ÷ $1,290 = 8.53%
This tells us that October typically accounts for 8.53% of annual revenue in this market. December was 11.2% (strongest month due to Christmas and New Year). September was 6.8% (weakest shoulder season).
Step 3: Extrapolate your partial data
Now let’s say you only have six months of actual performance data (October 2025 through March 2026). You want to project April 2026 through March 2027.
Take your October 2025 revenue and divide it by October’s seasonal weight:
October 2025 revenue: $13,876
October seasonal weight: 8.53%
Extrapolated annual potential: $13,876 ÷ 0.0853 = $162,651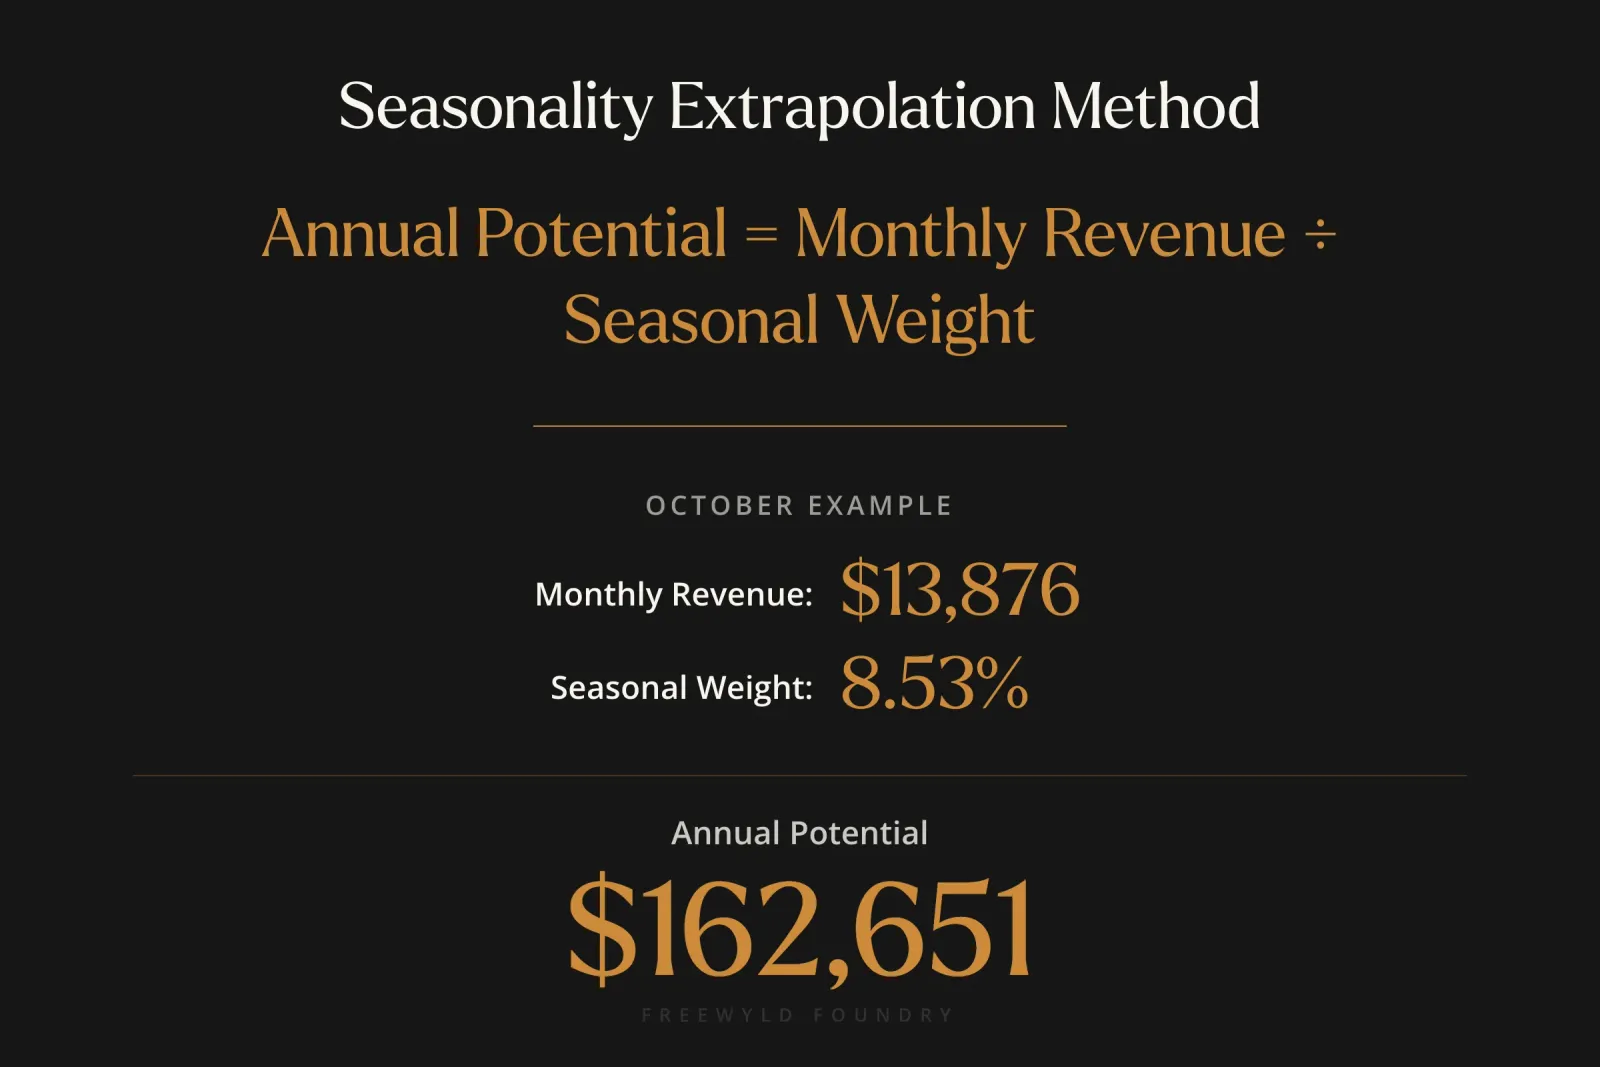
This calculation says: “If our portfolio continues to perform at the level it did in October, we would generate $162,651 annually.”
Do this for all six months you have data for:
| Month | Revenue | Seasonal % | Extrapolated Annual |
|---|---|---|---|
| Oct 2025 | $13,876 | 8.53% | $162,651 |
| Nov 2025 | $25,400 | 11.0% | $230,909 |
| Dec 2025 | $32,100 | 11.2% | $286,607 |
| Jan 2026 | $28,200 | 9.5% | $296,842 |
| Feb 2026 | $26,800 | 9.6% | $279,167 |
| Mar 2026 | $22,100 | 7.9% | $279,747 |
Step 4: Identify your steady-state performance
Look at the extrapolated annual numbers. In our example, October through December show an upward ramp (from $162K to $286K). This makes sense because these were the first three months we managed these cabins. Performance was improving as we dialed in pricing, built reviews, and optimized listings.
But January through March are relatively stable (all around $280K-$296K). This suggests our steady-state annual potential is somewhere around $280,000-$285,000.
Step 5: Apply seasonality to project future months
Now take your steady-state annual estimate ($280,000) and multiply it by each month’s seasonal percentage to get your monthly projections:
April 2026 projection = $280,000 × 7.2% = $20,160
May 2026 projection = $280,000 × 8.1% = $22,680
June 2026 projection = $280,000 × 9.4% = $26,320
Continue this for all 12 months you want to project.
“If we divide this number by 8.53%, then basically this tells us that if our portfolio was to perform as it did in October, then we would be making $162,000 on a yearly basis.” - Jasper Ribbers, Co-founder, Freewyld Foundry
Why This Method Is More Reliable Than Historical for New Units
Market seasonality data comes from thousands of properties. Your own six months of data comes from four units during a ramp-up period. Which is statistically more reliable?
The market pattern is far more stable. Your own numbers are noisy with onboarding effects, listing optimization, review accumulation, and pricing experiments.
By anchoring to market seasonality, you avoid the trap of assuming your November (a strong month) performance will repeat in April (a weaker month). The market pattern keeps you honest.
Adjusting for Known Anomalies
If you know certain months were affected by unusual events, adjust before extrapolating. In our case, we knew March had $2,000 less revenue due to a team stay. Adding that back before dividing by the seasonal percentage gives us a more accurate extrapolation.
Method 3: How to Project Revenue Using Current Bookings Plus Unbooked Potential
The forward-looking method is the only way to project revenue when you have zero historical data. It’s also the most dynamic method because it updates weekly as new bookings arrive.
This approach combines two numbers:
- Revenue already on the books (confirmed reservations)
- Potential revenue from dates still available (adjusted for realistic conversion)
Step 1: Create a custom report in PriceLabs
Go to Report Builder and click Create Your Own Report. Set Listings as your header row. Add Months as a second header row. Then select these metrics:
- Rental Revenue
- Available and Bookable Dates
- Potential Revenue
- Final Price
Set your date range to the 12 months you want to project (April 2026 through March 2027). Download the CSV.
Step 2: Understand what “potential revenue” means
Potential Revenue is what you would earn if every available date booked at the current calendar price. This number is fantasy for two reasons:
-
Prices will come down. As check-in dates approach, dynamic pricing lowers rates to drive occupancy. On average, prices decline 10-20% from initial calendar rates to final booked rates.
-
You won’t hit 100% occupancy. Even the best-managed portfolios typically run 75-85% occupancy. Expecting every available date to book is unrealistic.
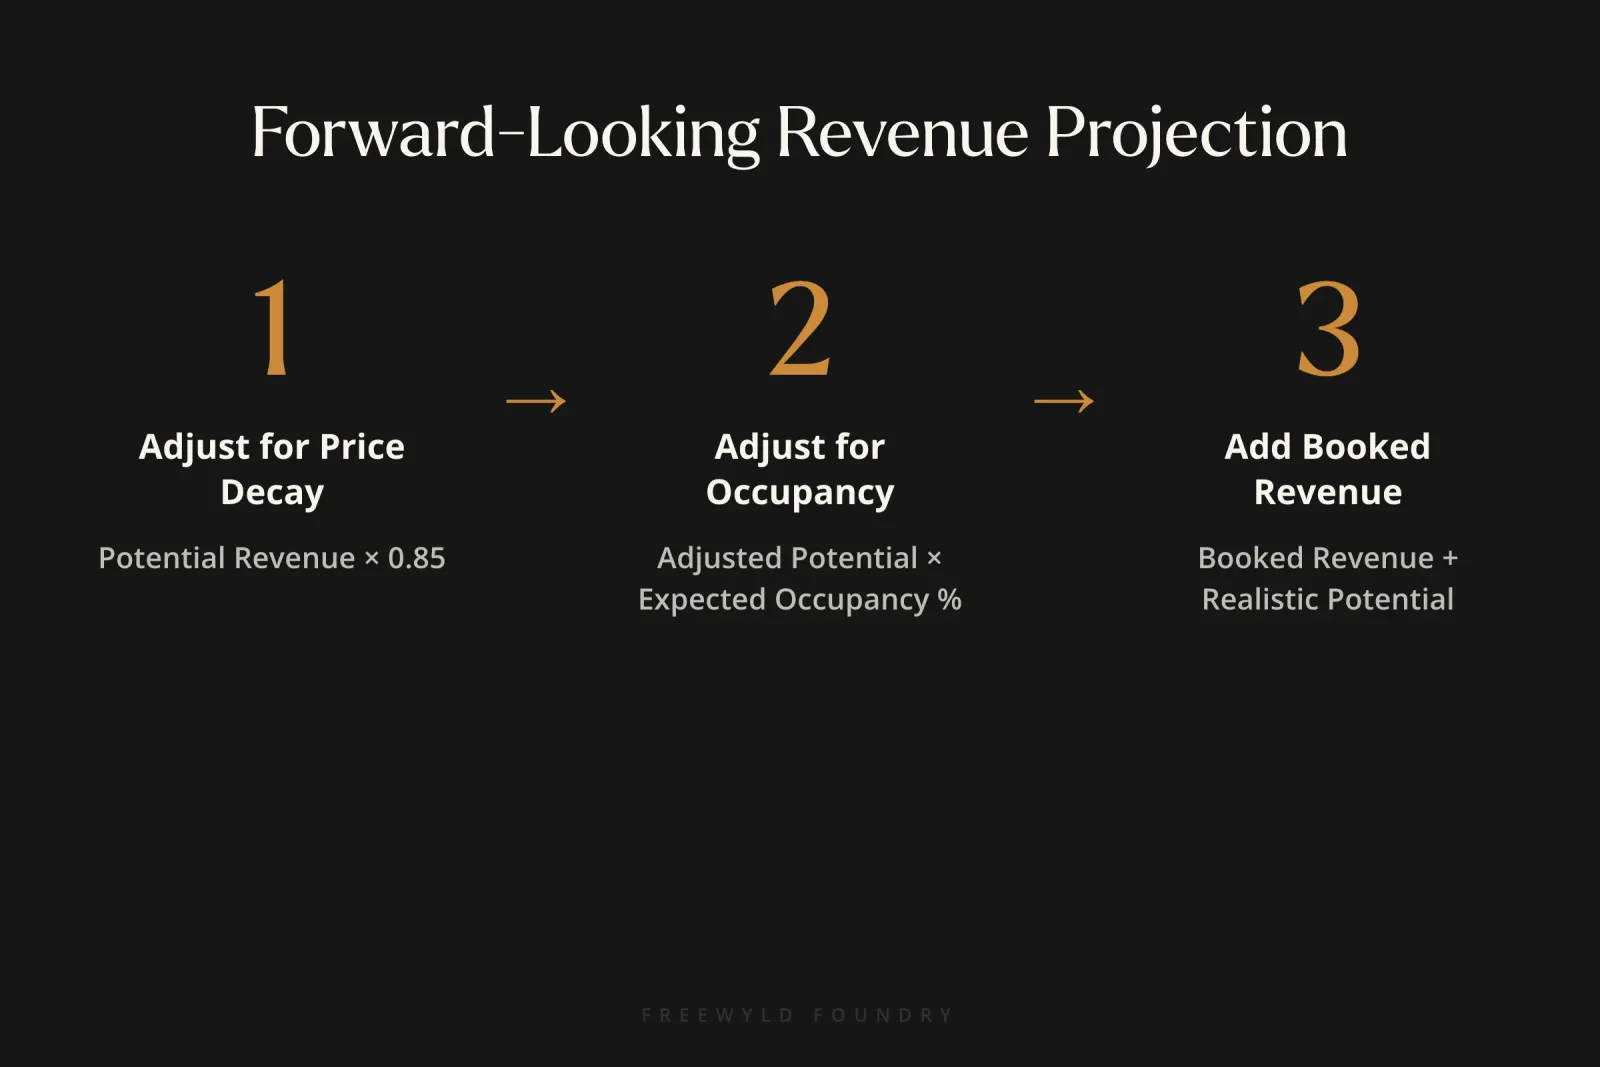
Step 3: Adjust potential revenue for price decay
Based on historical data from our portfolio, we know prices come down about 15% on average from calendar rates to booked rates. This varies by season (high-demand dates like Thanksgiving hold pricing better than shoulder season weekdays).
For simplicity, multiply your potential revenue by 0.85 to account for a 15% average price drop:
Adjusted potential = Potential revenue × 0.85Step 4: Adjust for realistic occupancy
Look at your historical occupancy by month. If you typically run 78% occupancy in July, don’t assume you’ll book 100% of available July dates. Multiply your adjusted potential by your expected occupancy rate:
Realistic potential = Adjusted potential × 0.78Step 5: Add your booked revenue
Now add the revenue you already have on the books:
Total projection = Booked revenue + Realistic potentialFor our Black Mountain cabin in April 2026:
- Booked revenue: $3,482
- Available potential: $7,463
- Adjusted for 15% price decay: $7,463 × 0.85 = $6,344
- Adjusted for 80% occupancy: $6,344 × 0.80 = $5,075
- Total April projection: $3,482 + $5,075 = $8,557
Why This Method Improves Over Time
The further out you project, the less reliable this method becomes. In April 2026 (one month away), you already have $3,482 booked and prices are fairly stable. Your April projection will be accurate.
But for November 2026 (seven months away), you have zero bookings and prices will change dramatically as you get closer. Your November projection is much less certain.
However, every week you can upload new booking data and recalculate. As April bookings arrive, your model learns your actual conversion rate from potential to booked. It gets smarter every week.
“You can now, once you have this, you could literally upload your bookings every week, new bookings and tell Claude, ‘Hey, here’s some new bookings. How does this affect our projections?’ And it will create an updated version for you.” - Jasper Ribbers, Co-founder, Freewyld Foundry
When to Use This Method
This method is essential when:
- You’re projecting for units that aren’t operational yet
- You have less than three months of historical data
- You want to track booking window strategy week-over-week
- You’re evaluating whether to adjust pricing strategy mid-year
It’s also the only method that incorporates your actual forward pricing strategy. If you just raised rates for summer, historical data won’t reflect that. But your calendar prices will.
How to Combine All Three Methods Into One Master Short Term Rental Revenue Projection
None of these methods is perfect alone. But together, they create a range you can trust.
Step 1: Run all three projections
Using the same 12-month period (April 2026 through March 2027), calculate projections using:
- Historical method (last year plus growth modifier)
- Seasonality method (extrapolated from recent performance)
- Forward-looking method (booked plus adjusted potential)
Step 2: Compare monthly projections
For each month, put all three projections side by side:
| Month | Historical | Seasonality | Forward | Average |
|---|---|---|---|---|
| Apr 2026 | $22,400 | $20,160 | $21,800 | $21,453 |
| May 2026 | $24,100 | $22,680 | $23,200 | $23,327 |
| Jun 2026 | $26,800 | $26,320 | $27,100 | $26,740 |
Step 3: Flag significant variances
If any month shows a spread of more than 15% between the highest and lowest projection, investigate. Something is off in your data or assumptions.
For example, if March 2027 projects as:
- Historical: $22,000
- Seasonality: $22,200
- Forward: $15,400
That 30% variance (forward is way lower) suggests either your calendar pricing is too low for March 2027, or you’re being too conservative with occupancy assumptions, or historical March data had an anomaly (like our team stay).
Step 4: Choose your final projection
Most operators use the average of all three methods. This balances the different perspectives and reduces the risk of any single method being wrong.
Some operators prefer a weighted average. For example:
- 40% weight on seasonality (most reliable for portfolio dynamics)
- 30% weight on forward-looking (incorporates current pricing strategy)
- 30% weight on historical (grounds you in actual performance)
For our Idyllwild portfolio, using straight averages across all three methods, the master projection is:
| Method | Annual Total |
|---|---|
| Historical (+5%) | $298,200 |
| Seasonality | $285,000 |
| Forward-looking | $281,600 |
| Average | $288,267 |
This is our best estimate for April 2026 through March 2027 revenue. It’s 1.5% higher than our T-12 actual of $284,000, which feels realistic given market conditions and portfolio improvements.
Common Short Term Rental Revenue Projection Mistakes to Avoid
1. Confusing rental revenue with total revenue
Rental revenue is the nightly rate only. It excludes cleaning fees, pet fees, resort fees, and any other ancillary charges. If you’re projecting cash flow or profitability, you need to add those back in separately. Don’t assume your projection already includes them.
2. Ignoring owner stays and maintenance downtime
If you block two weeks in June for owner use, that’s $4,000-$6,000 of potential revenue that won’t materialize. Either exclude those dates from your projection or mark them as $0 revenue months (not unavailable dates that get counted in potential).
3. Using portfolio-level projections for unit-level decisions
Just because your portfolio is projected to grow 8% doesn’t mean every unit will grow 8%. Some will grow 15%, others might decline 5%. Run projections at the unit level, especially when reporting to individual owners.
4. Forgetting about seasonality when projecting growth
If you compare June 2026 to May 2026 and see 12% revenue growth, that doesn’t mean you’re improving. June is a stronger month seasonally. You need to compare June 2026 to June 2025 (year-over-year) or adjust for the seasonal pattern.
5. Not updating projections as new data arrives
A projection made in January using December data is stale by April. Update your projections monthly (or weekly if you have the automation). Fresh data leads to better decisions.
How to Automate This Entire Process Using Claude AI in 10 Minutes
Everything I’ve shown you so far takes about 2-3 hours to build manually in Google Sheets. But you can automate the entire process using Claude AI and reduce it to 10-15 minutes.
Step 1: Open Claude and set context
Start a new chat in Claude. Give it your objective and tell it not to start building until you give permission:
Hi Claude. I want to make revenue projections for my STR portfolio in [location].
I have [number] properties and want to project revenue for [date range].
I will give you three different methods to use. Don't start building until I say go.
Step 2: Explain your three methods
Tell Claude you want it to use:
- Historical data (T-12 revenue with growth modifier)
- Seasonality (market RevPAR to extrapolate annual potential)
- Forward-looking (booked revenue plus adjusted potential)
Step 3: Upload your data files
Attach the CSV files you downloaded from PriceLabs:
- Charts data CSV (portfolio historical revenue)
- Listing performance CSV (unit-level historical revenue)
- Market summary CSV (seasonality data)
- Custom report CSV (booked revenue and potential)
Step 4: Answer clarifying questions
Claude will ask questions like:
- Which year of market data should I use for seasonality?
- Should I use unit-level or portfolio-level occupancy assumptions?
- What price decay factor should I apply (10%, 15%, 20%)?
Answer these based on your market knowledge and historical patterns.
Step 5: Request your output format
Tell Claude exactly what you want:
Create a Google Sheets workbook with four tabs:
1. Method 1 - Historical (last year plus growth modifier by month)
2. Method 2 - Seasonality (extrapolated annual using market patterns)
3. Method 3 - Forward-looking (booked plus adjusted potential)
4. Master - Average of all three methods with variance analysis
Step 6: Review and iterate
Claude will generate an Excel file (Google Sheets doesn’t have native Claude integration yet, but you can upload the Excel file to Drive). Open it and scan for issues.
Common problems on first pass:
- Missing data for certain months (usually formatting issues)
- Column widths too narrow to read numbers
- Seasonal weights not summing to 100%
Screenshot any issues, upload them back to Claude, and say “November 2026 data is missing, please fix.” It will regenerate the file.
Step 7: Save the chat for weekly updates
Don’t close this Claude chat. Save it. Every week when you download fresh booking data from PriceLabs, come back to this same chat and upload the new file with a simple prompt:
Here are this week's bookings. How does this affect our projections?Claude remembers all the context (your market, your units, your methodology). It will recalculate just the forward-looking tab and update the master projection. This takes 2-3 minutes instead of 30 minutes of manual Excel work.
“It’s really nice to work with Claude because it’s like having a team member. It’s like a person that you’re talking to. And it will ask you questions. It will give you answers.” - Jasper Ribbers, Co-founder, Freewyld Foundry
Tools You Need for Automated Short Term Rental Revenue Projection
- PriceLabs account (even the free version works for downloading data)
- Claude Pro subscription ($20/month, needed for file uploads)
- Google Sheets or Excel (free)
- Whisper (optional voice-to-text tool to speed up prompting)
Frequently Asked Questions About Short Term Rental Revenue Projection
How accurate should I expect my STR revenue projections to be?
Using a single method (historical only), expect 15-25% variance from actual results. Using all three methods, expect 5-10% variance. External factors (market crashes, new regulations, natural disasters) can always create outliers, but under normal conditions, a well-constructed three-method projection should land within 10% of actuals.
What if I only have three months of historical data?
Use the seasonality method as your primary projection and the forward-looking method as a reality check. Skip the historical method entirely since three months is too noisy. After six months, you can start incorporating historical data into your mix.
Should I project gross revenue or net revenue after expenses?
These methods project rental revenue only (the nightly rate guests pay). To get to net operating income, you need to add cleaning fees and ancillary charges, then subtract operating expenses (cleaning costs, maintenance, supplies, management fees, OTA commissions). Do that projection separately after you have rental revenue nailed down.
How often should I update my projections?
Quarterly at minimum. Monthly is better. Weekly is optimal if you have automation set up. The more frequently you update, the faster you catch trends (positive or negative) and can adjust strategy.
What growth modifier should I use for the historical method?
Conservative: 0-3% (market is flat or declining) Moderate: 3-7% (stable market with incremental improvements) Aggressive: 7-12% (strong market growth or major portfolio upgrades)
Never use more than 15% growth unless you have exceptional circumstances (added amenities, completed major renovation, changed pricing strategy dramatically).
How do I adjust projections for new unit launches?
When launching new STR units, start with forward-looking method only for the first 60 days. After 90 days, introduce seasonality method. After 12 months, you can include historical method. New units need time to stabilize before historical patterns become reliable.
What’s the difference between revenue projection and revenue management?
Short term rental revenue projection forecasts future income. Revenue management is the strategic process of optimizing pricing, inventory, and distribution to maximize that income. Projection tells you what to expect. Management tells you how to improve it.
Can I use these methods for VRBO and Booking.com properties?
Yes. The three-method system works for any booking channel. PriceLabs aggregates data across all channels, so your historical and forward-looking data already includes VRBO and Booking.com. Market seasonality may vary slightly by channel, but for most markets the patterns align within 5-10%.
Conclusion: Building Confidence Through Multi-Method Short Term Rental Revenue Projection
Accurate revenue projections are not about predicting the future perfectly. They’re about reducing uncertainty enough to make better business decisions.
The three-method system (historical, seasonality, forward-looking) works because each method captures something the others miss. Historical grounds you in actual performance. Seasonality adjusts for market patterns. Forward-looking incorporates your current strategy and booking momentum.
Where all three methods agree, you have high confidence. Where they diverge, you have an investigation to do.
The key insight is this: Single-method projections are dangerous because they hide assumptions. Multi-method projections surface those assumptions and force you to reconcile them. That process of reconciliation is where the real value lives.
For operators managing $1M+ in annual bookings, being 5% more accurate in projections means the difference between hitting your numbers and missing by $50,000. It means hiring the right staff at the right time. It means expanding into new units when your portfolio can support them (not six months too early or too late).
And with Claude automation, you can maintain this level of sophistication with 15 minutes of work per week instead of 3 hours per month.
Start with the manual build. Understand the three methods. Then automate. That sequence ensures you know what the AI is doing and can spot when it makes a mistake.
Want expert help optimizing your STR revenue?
Freewyld Foundry has built AI-powered tools that connect directly to PriceLabs, pull your portfolio data, compare it against market benchmarks, and calculate your exact revenue uplift potential. We work exclusively with operators managing $1M+ in annual bookings and deliver an average 18% performance lift above market.
Related Resources:
- Episode 710: Building a Market Penetration Index with Claude AI
- How Revenue Management Increases STR Income
- How to Track STR KPIs
- Dynamic Pricing Airbnb: How It Works
- 5 Revenue Management Mistakes Costing STR Operators Money
Listen to the full conversation: Get Paid for Your Pad Podcast Episode 710
About Jasper Ribbers: Jasper Ribbers is co-founder of Freewyld Foundry, where he oversees revenue and pricing strategy for a portfolio managing $190M+ in annual STR bookings. He hosts the Get Paid for Your Pad podcast (700+ episodes) and specializes in helping professional operators scale revenue through data-driven pricing. Connect with Jasper on LinkedIn