Stop Chasing Occupancy: 3 STR Revenue Management Mistakes Costing You $10,000+ Per Month
You just closed your best booking month ever. Your occupancy rate hit 90%. Your calendar looks packed. You feel like you are finally crushing it in the short-term rental game.
But here is the uncomfortable truth: you probably left $10,000 or more on the table. And the data proves it.
After 14 years managing revenue for short-term rental portfolios, I have seen this pattern in almost every portfolio we analyze. STR revenue management mistakes cause operators to celebrate high occupancy while unknowingly competing in a race to the bottom that kills their revenue potential.
The problem is not that you are bad at your job. The problem is that you are measuring the wrong thing. This article will walk you through the three biggest STR revenue management mistakes that trap operators in the occupancy mindset, and show you exactly how to fix them using proven strategies from portfolios managing over $180 million in annual bookings.
What Is the Occupancy Trap in STR Revenue Management?
The occupancy trap is a common STR revenue management mistake that happens when short-term rental operators focus on filling beds instead of maximizing revenue per available night. This creates a false sense of success that masks massive revenue losses.
Here is how the math works in the real world:
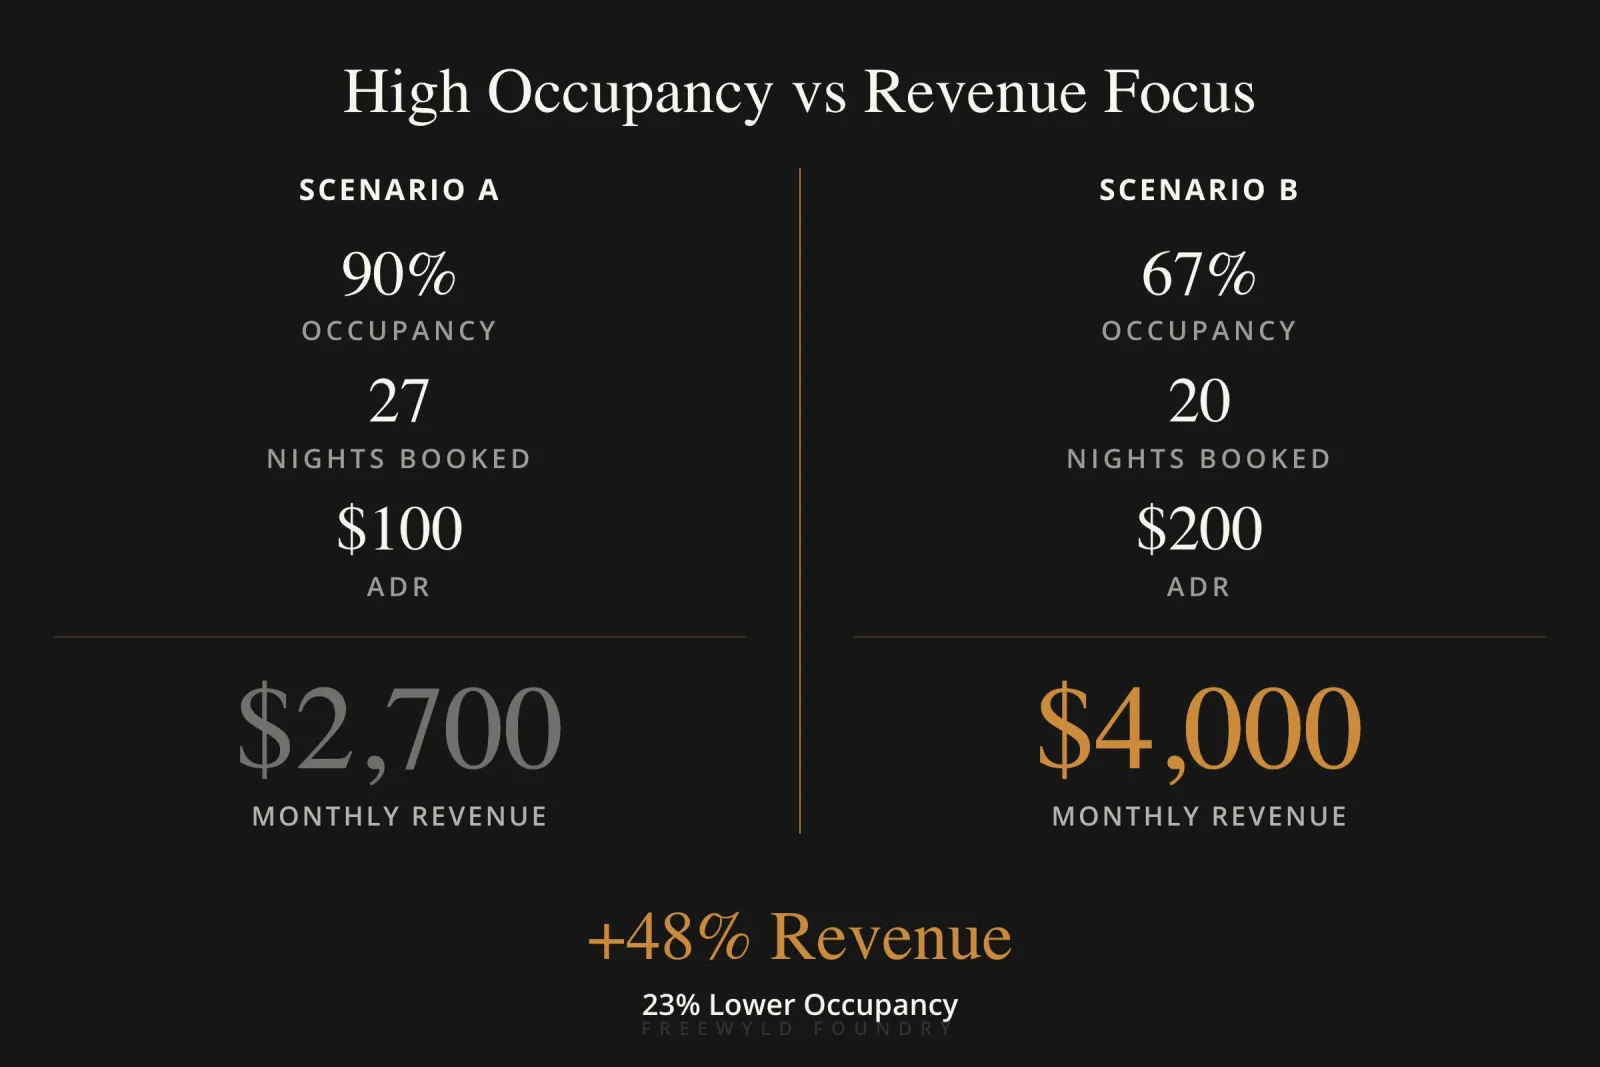
Scenario A (High Occupancy Focus):
- 90% occupancy for the month
- 27 nights booked out of 30 days
- $100 average daily rate (ADR)
- Total revenue: $2,700
Scenario B (Revenue Management Focus):
- 67% occupancy for the month
- 20 nights booked out of 30 days
- $200 average daily rate
- Total revenue: $4,000
Scenario B generates 48% more revenue with 23% lower occupancy. That extra $1,300 per month per property adds up to $15,600 annually. For a 10-property portfolio, that is $156,000 in found money.
Yet most operators would look at Scenario A and feel successful because they hit 90% occupancy. They have no reason to believe Scenario B is even possible because they are not tracking the right STR KPIs.
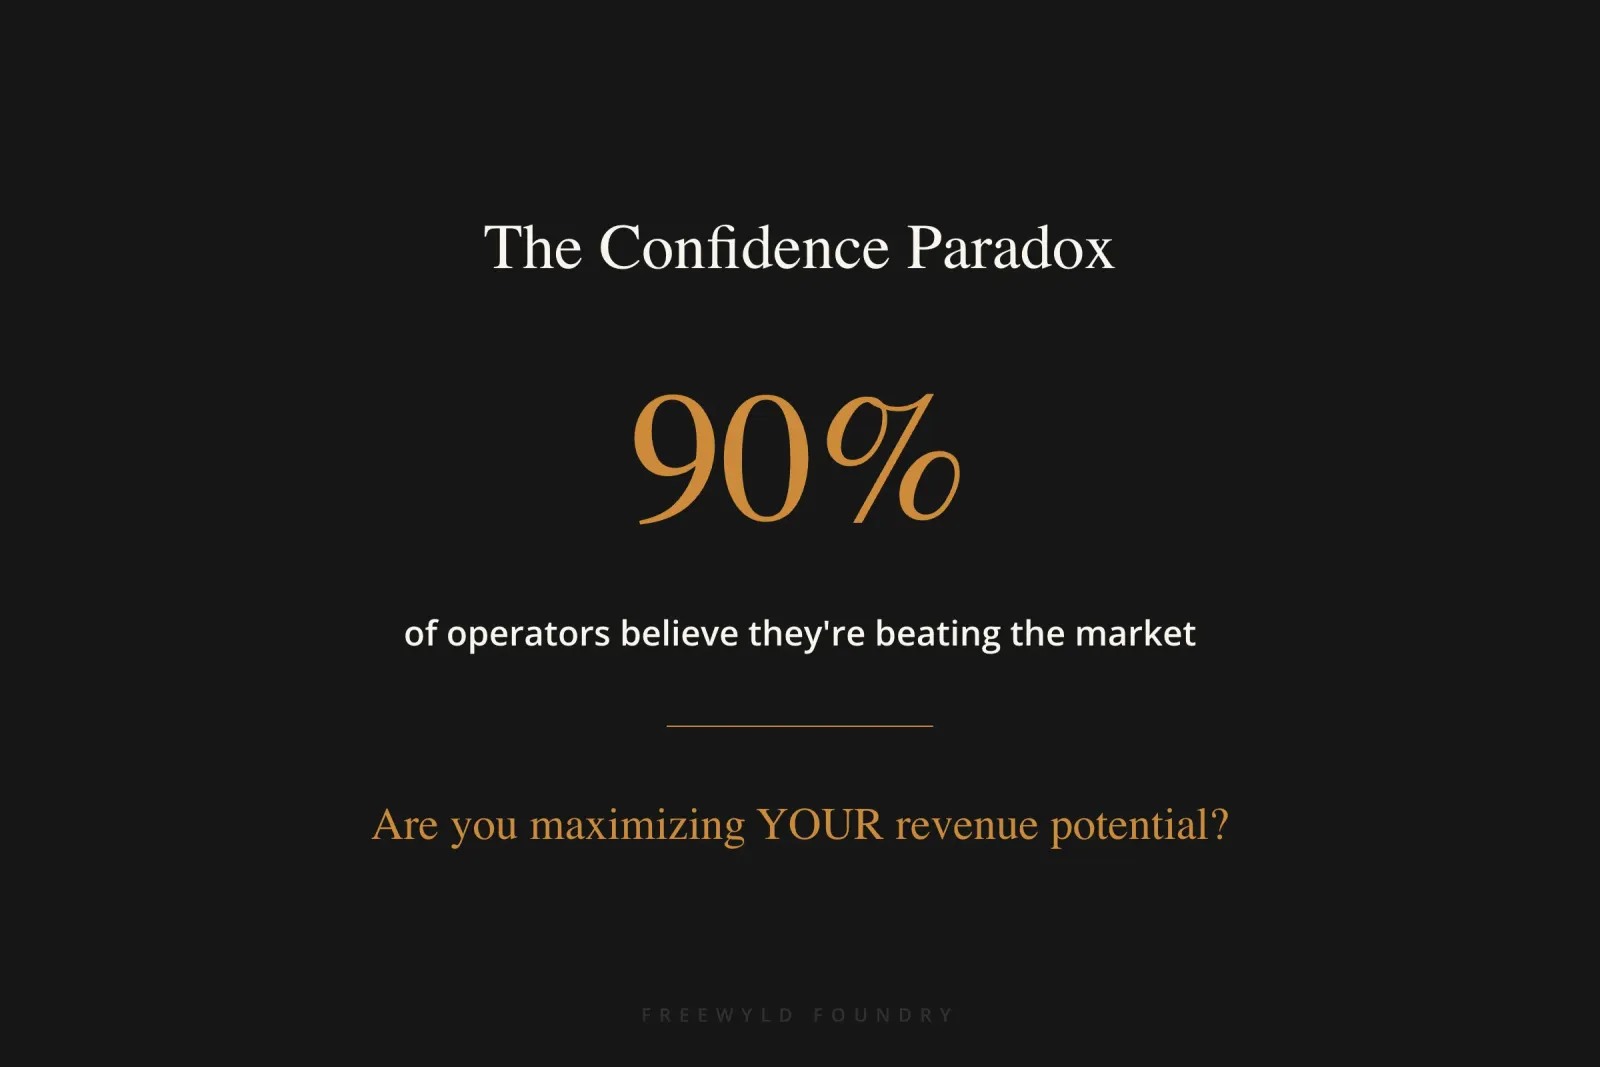
According to industry data, 90% of operators who approach revenue management firms believe they are already beating the market. This confidence comes from comparing themselves to the market average, which includes unprofessional operators and terrible pricing strategies. It is like being the best player on the worst team and thinking you are ready for the pros.
“You don’t know what you don’t know. You have no reason to believe that you can increase your revenue.”
The occupancy trap keeps you stuck because you lack visibility into three critical areas: booking window timing, market pacing data, and bookability factors beyond pricing. Fix these three STR revenue management mistakes and you will see revenue increases of 10% to 50%, depending on your starting point.
What Are the 3 Biggest STR Revenue Management Mistakes?
Mistake 1: The Set It and Forget It Approach to Dynamic Pricing
The first critical mistake is treating revenue management for short-term rentals like a one-time setup instead of an ongoing process. Most operators follow this pattern:
- Turn on a pricing tool (Beyond, PriceLabs, Wheelhouse)
- Set some basic rules and minimums
- Check in once or twice per week
- Focus only on filling the next 2-4 weeks
This creates several compounding problems. When you only look at your calendar weekly or monthly, you miss the early booking window where premium pricing lives. People typically start booking 2-6 months out for most markets. If you are not monitoring and adjusting prices during this critical period, you will miss high-value bookings entirely.
The second issue is the short-term focus. When operators do check their calendars, they fixate on gaps in the next 30 days. They ask questions like “What days are still open next week?” and “What prices can we lower to fill last-minute demand?” This reactive approach forces you into the least profitable segment of the booking window.
Here is what happens in most markets during the booking window:
| Time Before Check-in | Operator Behavior | Guest Behavior | Result |
|---|---|---|---|
| 60-90+ days out | High minimum stays, waiting for bookings | Premium guests booking | Properties get skipped |
| 30-45 days out | Slightly reduce minimums and prices | Mid-tier guests comparing options | Some bookings, but not premium |
| 15-30 days out | Drop prices 10-20%, reduce minimums | Price shoppers entering market | Revenue compression begins |
| 0-14 days out | Panic mode, race to minimums | Bottom-tier demand only | Lowest possible ADR |
When you only focus on the next few weeks, you are perpetually operating in the bottom two rows of this table. The premium demand already booked elsewhere months ago.
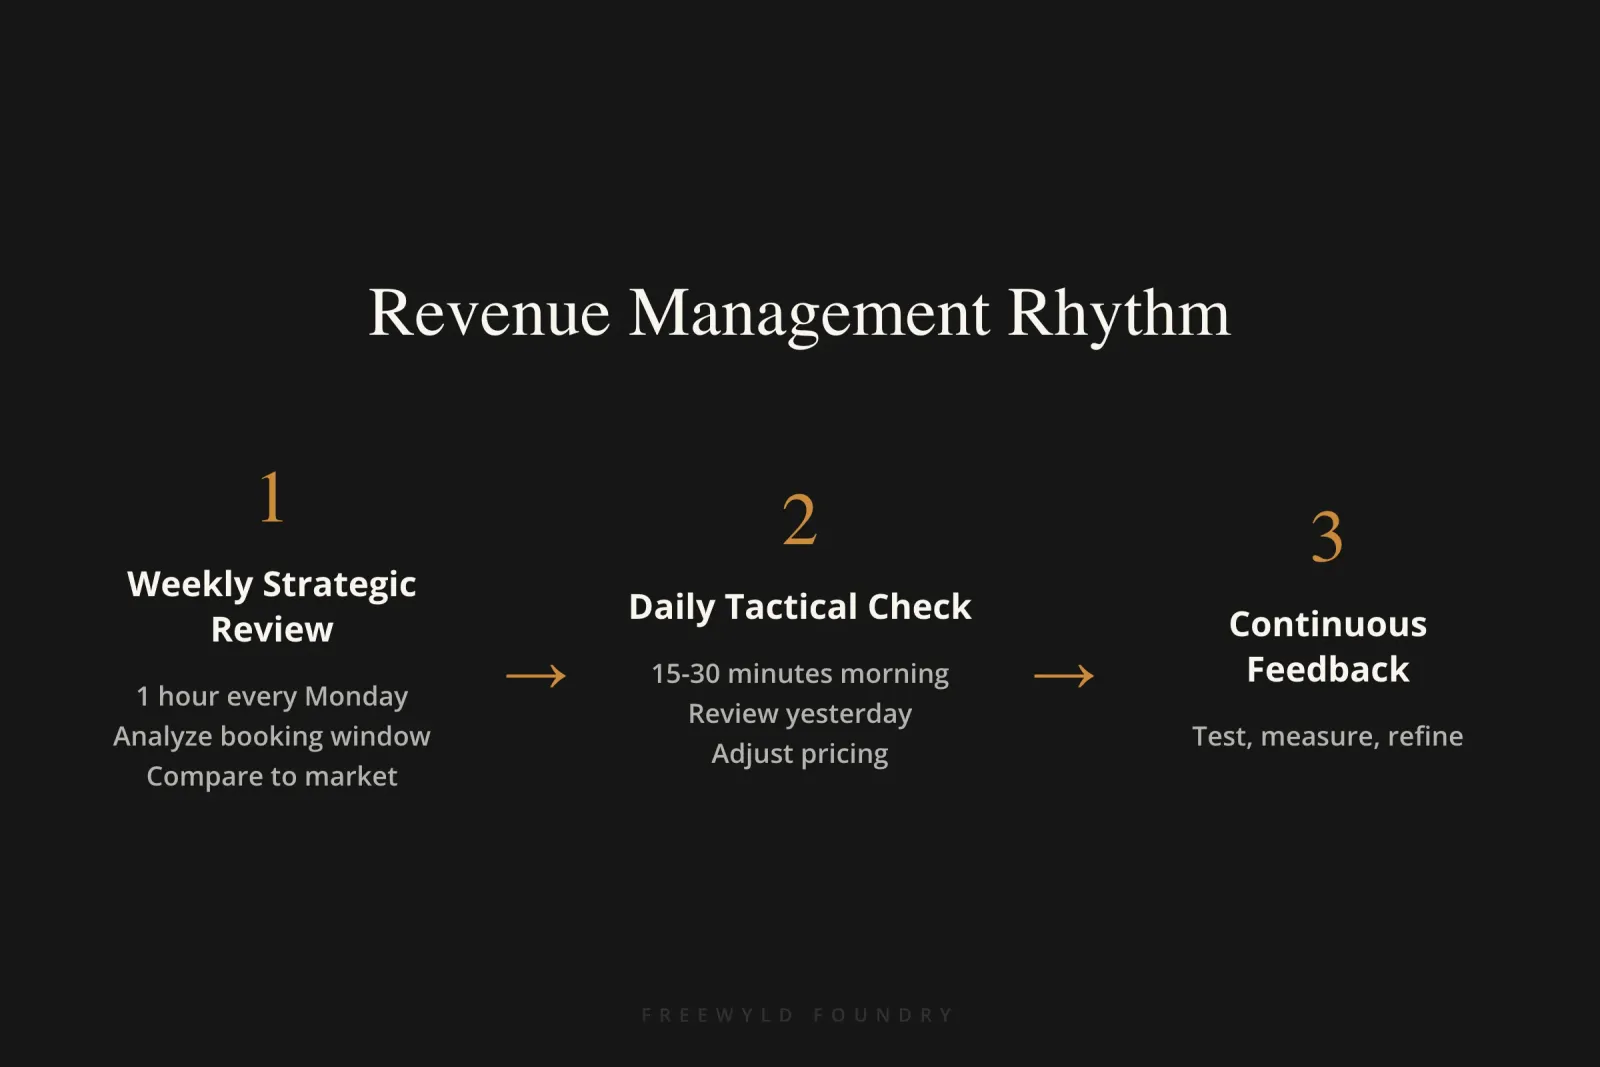
The fix requires implementing a revenue management routine. Block one hour per week for strategic review and 15-30 minutes daily for tactical adjustments. During your weekly hour, analyze the full booking window for each property. Which properties are pacing ahead or behind compared to last year and market comps? Where are gaps forming 2-3 months out that need attention now?
During your daily 15-30 minutes, make tactical pricing moves based on yesterday’s market activity. Did competitor properties get booked in your segment? Did you get views but no bookings, suggesting a price resistance point? This consistent attention creates a feedback loop that set-it-and-forget-it approaches can never achieve.
Mistake 2: Flying Blind Without Market Pacing Data
The second major STR revenue management mistake is not tracking when bookings enter the market. Most operators only look at their own calendars and maybe check a few competitor listings on Airbnb or Vrbo. But this gives you almost no useful information about market pacing.
Market pacing tells you when guests are actually booking properties like yours. Are bookings for December coming in during June or during November? This timing is everything in revenue management. If bookings typically come in 120 days before check-in and your prices are not competitive until 60 days out, you have already lost all the premium demand.
Operators who lack market pacing data make several predictable errors:
Error 1: Wrong benchmark comparison. They compare their performance to the market average. The market average is terrible. It includes amateur hosts with bad photos, poor reviews, inconsistent pricing, and zero revenue management strategy. Beating this average means almost nothing.
When operators tell us “we are outperforming the market” with 80% occupancy versus the market’s 70%, they are comparing themselves to a benchmark that includes the bottom 50% of properties. It is like saying you run faster than people who don’t exercise. The real question is: are you maximizing your unique revenue potential?
Error 2: Blind spot on booking window shifts. Markets change. In 2019, most leisure travel booked 60-90 days out. During 2020-2021, booking windows collapsed to 0-30 days as people made last-minute pandemic decisions. By 2022-2023, windows extended again but not uniformly across all markets. Some mountain markets now see 6-12 month booking windows for peak ski season. Beach markets might book 90-120 days for summer.
If you are not tracking this actively, you will price and position your properties based on outdated assumptions. You will wonder why you are not getting bookings when in reality, all the bookings already happened and you were not competitive when it mattered.
Error 3: No visibility into competitive positioning. You need to know not just when bookings happen, but which properties get booked first. Are the premium properties booking early at high rates? Are the mid-tier properties waiting longer but still capturing decent rates? Are the budget properties slashing prices early?
This intelligence tells you where you sit in the market hierarchy and whether your pricing reflects that position. A common mistake is pricing a mid-tier property at premium rates early in the booking window. The property gets skipped entirely during the premium booking phase, then struggles to compete during the mid-tier phase because it has already been viewed and rejected by hundreds of guests.
Mistake 3: Too Many Restrictions That Kill Bookability
The third critical STR revenue management mistake is treating revenue management as purely a pricing exercise. Pricing matters enormously, but it is only one factor in the booking decision. Even perfect prices will not generate bookings if your property is difficult to book or hard to find.
This is where bookability comes in. Bookability measures how easy and attractive it is for guests to actually book your property. Several factors impact bookability:
Cancellation Policies: Strict or firm cancellation policies reduce bookings significantly. Guests do not want to lock in 60-90 days before check-in with no flexibility. Yes, Airbnb offers a 24-48 hour grace period for full refunds. But after that window, guests with strict policies are stuck. This uncertainty kills bookings, especially in the early booking window where you want premium rates.
Flexible cancellation policies generate more bookings at higher rates because guests feel comfortable committing early. The trade-off is potential cancellations, but the data shows flexible policies win on total revenue in most markets. There are strategic exceptions for high-demand events where guests will accept strict policies, but these are rare.
Minimum Night Stays: Most operators use what I call the “standard progressive minimum” strategy. It looks like this:
- 0-30 days out: 2-night minimum
- 30-45 days out: 3-night minimum
- 45-60 days out: 4-night minimum
- 60+ days out: 5+ night minimum
The logic seems sound: early bookings should be longer to lock in revenue. But this strategy backfires in multiple ways.
First, shorter stays typically generate higher ADR. A couple booking a weekend getaway will pay $300/night. A family booking a week-long vacation expects volume pricing around $150-200/night. By restricting short stays early, you block your highest ADR opportunities.
Second, OTA algorithms penalize restrictive properties. When you require a 5-night minimum 90 days out, you are only visible to guests searching for 5+ night stays. This is a tiny subset of total demand. Properties with fewer restrictions show up in more searches and get more bookings.
I have worked with portfolios that allow one-night stays across the entire calendar year. These portfolios consistently outperform on both occupancy and ADR because they maximize flexibility and OTA visibility. Yes, there are operational considerations with one-night stays. But the revenue impact is undeniable.
Instant Book Settings: Not using instant book is a revenue management mistake. It is not just an operational preference. OTA platforms strongly favor instant book properties in Airbnb’s search algorithm. All else being equal, an instant book property will rank higher than a request-to-book property.
Instant book also increases conversion rates. Guests browsing late at night do not want to send requests and wait for approval. They want to book now. If your property requires requests, they will book the instant book competitor instead.
Listing Quality: This seems obvious, but it belongs in the revenue management conversation. Professional photos, detailed descriptions, and 4.8+ star reviews are not optional nice-to-haves. They are revenue drivers. You can have perfect pricing and bookability settings, but poor listing quality will crater your conversion rate and search visibility.
Here is a real-world example: I analyzed a portfolio where properties had identical pricing, locations, and bed configurations. Properties with professional photography and 4.9+ ratings booked at $180 ADR and 82% occupancy. Properties with owner photos and 4.5 ratings booked at $140 ADR and 68% occupancy. The listing quality difference drove 29% ADR premium and 14 percentage point occupancy lift.
How Do You Calculate the Revenue You Are Leaving on the Table?
To calculate your missed revenue opportunity, you need to compare your actual performance against your achievable potential. This requires three data points:
Current Performance Metrics:
- Monthly revenue per property
- Average ADR
- Occupancy percentage
- Booking window distribution (what percentage of bookings come in at 0-30 days, 30-60 days, 60-90 days, etc.)
Market Pacing Benchmarks:
- When do bookings typically enter your market segment?
- What ADR do properties achieve at different points in the booking window?
- How does your occupancy curve compare to top-performing comparable properties?
Bookability Audit Results:
- How many calendar days are currently unbookable due to minimum stay restrictions?
- What is your search visibility ranking compared to similar properties?
- How many booking requests or inquiries convert to actual bookings?
Once you have this data, the revenue gap becomes clear. Most operators find they are leaving 15-35% on the table through booking window timing alone. Add in bookability restrictions and the total opportunity often exceeds 40-50%.
For a property currently generating $60,000 in annual revenue, a 25% improvement adds $15,000 per year with no additional units. For a 20-property portfolio, that is $300,000 in found revenue annually.
What Revenue Management Tools and Systems Do Top Performers Use?
Top-performing STR operators use a combination of technology and human oversight. The technology handles data analysis and initial pricing suggestions. The human oversight makes strategic decisions that tools cannot automate.
Dynamic Pricing Software: Tools like Beyond Pricing, PriceLabs, and Wheelhouse provide baseline automation. They adjust prices based on supply, demand, seasonality, and events. These tools are necessary but not sufficient. They all use similar data sources and algorithms, which means they produce similar results. Relying solely on automated tools means you get market-average performance.
Market Intelligence Platforms: Services like AirDNA, Transparent, and MarketMinder provide market-level data on occupancy rates, ADR trends, and supply growth. This data helps you understand the broader context for your pricing decisions.
Revenue Management Calendars: Top operators maintain detailed calendars showing not just their own bookings, but market booking pace, competitor rate changes, and upcoming events. This visual dashboard makes patterns obvious that would be invisible in spreadsheets.
Pacing Reports: These track how each property is performing against the booking curve. A property that is 40% booked 60 days before check-in when the market average is 65% booked is pacing behind. This signals a pricing or bookability issue that needs immediate attention.
Competitive Sets: Identify 5-10 properties that compete directly with each of your listings. Track their pricing, availability, and search ranking weekly. This gives you ground truth on whether your positioning is working.
The best approach combines automated baseline pricing with daily human review and weekly strategic planning. The tools handle the math. Humans make the judgment calls that capture the extra 10-20% the tools miss.
Common Mistakes to Avoid in STR Revenue Management
Mistake 1: Trusting automated pricing without oversight. Pricing tools are starting points, not finished products. They miss local events, cannot assess listing quality differences, and do not optimize for your specific business goals (maybe you prefer higher ADR with lower occupancy for operational reasons).
Mistake 2: Making panic-driven price drops. When a weekend stays empty with 10 days to go, most operators slash prices 30-50%. This usually does not work because by that point, guests have already booked elsewhere. You end up with empty dates AND depressed pricing for future similar dates as the algorithm learns your panic pattern.
Mistake 3: Using the same strategy for all properties. Each property in your portfolio has different competitive positioning. Your premium lakefront property should use aggressive early pricing to capture high-ADR bookings. Your budget property near the highway might perform better with competitive pricing throughout the booking window to maximize occupancy.
Mistake 4: Ignoring shoulder season opportunities. Most operators focus on peak season and let shoulder season run on autopilot. But shoulder season often has the highest profit margins because you can maintain decent rates with lower guest acquisition costs and less operational stress.
Mistake 5: Overvaluing occupancy in performance reviews. When evaluating property managers or your own performance, using occupancy as the primary metric creates perverse incentives. It encourages the race-to-the-bottom pricing that kills revenue. Use revenue per available night (RevPAN) or total revenue as your north star metric instead.
How to Implement a Revenue Management System for Your STR Portfolio
Step 1: Set up your revenue management rhythm. Block one hour every Monday morning for strategic review. Block 15 minutes every morning for tactical pricing checks. Put these on your calendar as non-negotiable appointments. Revenue management only works with consistent attention.
Step 2: Build your market intelligence dashboard. Identify your competitive set for each property. Set up tracking systems to monitor their pricing, availability, and search rankings. Create a simple spreadsheet or use a tool like AirDNA to track key metrics weekly.
Step 3: Audit your bookability factors. Review every property’s cancellation policy, minimum night stays, instant book settings, listing quality, and guest requirements. Score each property on bookability using this framework:
- Flexible cancellation: +2 points
- Instant book enabled: +2 points
- No minimum stays or 2-night max: +2 points
- Professional photos: +2 points
- 4.8+ star rating: +2 points
Properties scoring 8-10 have high bookability. Properties scoring below 6 need immediate fixes.
Step 4: Map your booking window curves. Pull your booking data for the past 12 months. Calculate what percentage of bookings came in at different time intervals (0-30 days, 30-60 days, 60-90 days, etc.). Compare this to your market’s typical booking curve. If you are heavily skewed to last-minute bookings compared to the market, you have a pricing or bookability problem in the early window.
Step 5: Implement a testing framework. Revenue management is not about finding the “perfect” price. It is about continuous testing and improvement. Pick one property as your test case. Try more aggressive early pricing with flexible minimums for one month. Measure the results against your control properties. If it works, roll it out to more properties.
Step 6: Calculate your baseline and set targets. Document your current monthly revenue per property. Set a realistic target for 90 days out (typically 10-15% improvement is achievable). Track your progress weekly. Adjust your strategy based on what the data shows.
Step 7: Review and refine quarterly. Every 90 days, do a comprehensive review of what worked and what did not. Which properties exceeded targets? Which fell short? What market conditions changed? Use these insights to refine your strategy for the next quarter.
Real-World Example: Fixing the Occupancy Trap
A property management company came to us managing 25 properties in a mountain market. They proudly reported 85% average occupancy versus the market’s 72% occupancy. Their average ADR was $175 versus the market’s $160. By their calculations, they were crushing it.
We analyzed their booking window data and found a different story. While they achieved high occupancy, 68% of their bookings came in within 30 days of check-in. Market leaders in their segment generated only 40% of bookings in that window. The difference mattered enormously.
The portfolio was using progressive minimum night stays (5-night minimum 60+ days out, dropping to 2-night minimum in the last 30 days). They had firm cancellation policies across all properties. They avoided instant book due to “quality control concerns.”
We implemented three changes:
Change 1: Reduced minimum night stays to 2-night maximum across the entire calendar, with 1-night stays allowed for premium properties.
Change 2: Switched to flexible cancellation policies for all non-holiday periods.
Change 3: Enabled instant book on 80% of properties after implementing automated screening rules.
Within 90 days, the results were dramatic:
| Metric | Before | After | Change |
|---|---|---|---|
| Average ADR | $175 | $218 | +24.6% |
| Occupancy | 85% | 78% | -7 percentage points |
| Revenue per property | $4,463/month | $5,140/month | +15.2% |
| Bookings 60+ days out | 18% | 42% | +24 percentage points |
The portfolio generated 15.2% more revenue with 7 percentage points lower occupancy. They captured significantly more early bookings at premium rates, which allowed them to be more selective about last-minute bookings. Occupancy “dropped” but only because they stopped accepting low-rate last-minute bookings that were not worth the operational hassle.
According to the CEO, “We thought we were doing great because we looked at occupancy. We had no idea we were training our pricing algorithm to chase last-minute bookings by consistently lowering prices. Once we gave guests more flexibility to book early, everything changed.”
Frequently Asked Questions About STR Revenue Management Mistakes
How do I know if I am stuck in the occupancy trap?
Calculate the percentage of your bookings that come in within 30 days of check-in. If this number is above 50%, you are likely leaving revenue on the table. Top performers generate 60-75% of bookings more than 30 days before check-in at premium rates. Also compare revenue per available night (total revenue divided by available nights) against your occupancy rate. If you have 90%+ occupancy but RevPAN is in the bottom half of your market, you are in the occupancy trap and making critical STR revenue management mistakes.
What is a good target occupancy rate for STR properties?
There is no universal answer because it depends on your market and strategy. In most markets, 70-80% occupancy with premium ADR outperforms 90%+ occupancy with discounted rates. Focus on maximizing total revenue, not hitting an arbitrary occupancy percentage. Some luxury properties perform best at 60-65% occupancy with very high ADR. Budget properties might target 85-90% occupancy with competitive rates. Calculate your break-even occupancy (what occupancy rate covers all costs) and aim for 10-15 percentage points above that to avoid common STR revenue management mistakes.
Should I always use flexible cancellation policies?
Flexible policies outperform strict policies in approximately 80% of situations. The exceptions are major events (Super Bowl, music festivals, major holidays) where demand is certain and guests accept restrictions. For normal periods, flexible policies generate more bookings at higher rates because guests feel comfortable committing early. The cancellation rate typically runs 5-8%, but the increased bookings and higher ADR more than offset the occasional cancellation.
How long should minimum night stays be for STR properties?
Start with a 2-night minimum as your baseline and only add restrictions when data proves it helps. For most properties in most periods, shorter minimums generate more revenue because they capture high-ADR weekend bookings and improve OTA visibility. Test 1-night minimums on premium properties in high-demand periods. Reserve longer minimums (3+ nights) for specific circumstances like holidays where operational efficiency matters or properties with high cleaning costs where short stays are not profitable.
Can revenue management strategies work in small markets with limited demand?
Yes, but the approach differs from high-demand markets. In small markets, bookability and visibility matter even more because the pool of potential guests is smaller. Use flexible policies, minimal restrictions, and instant book to capture maximum share of available demand. Your pricing needs to be sharper because you have less room for error. Focus on capturing bookings early in the booking window because last-minute demand may not materialize. The same principles apply but the margin for error is smaller.
What is the difference between a pricing tool and a revenue manager?
Pricing tools automate rate adjustments based on algorithms and market data. Revenue managers combine tool outputs with strategic decisions about positioning, restrictions, and market timing. Tools provide the baseline. Revenue managers capture the 10-30% additional upside through informed judgment calls that algorithms cannot make.
How much should I invest in revenue management for my STR portfolio?
For portfolios under 10 properties, invest time in learning revenue management fundamentals and use pricing tools effectively. For portfolios of 10-50 properties, consider hiring a part-time revenue specialist or outsourcing to a revenue management service. For portfolios over 50 properties, a full-time revenue manager typically pays for themselves many times over through incremental revenue gains.
What metrics should I track to avoid STR revenue management mistakes?
Track revenue per available night (RevPAN), average daily rate (ADR), occupancy rate, booking window distribution, and comparison to competitive set performance. Secondary metrics include cancellation rates, inquiry-to-booking conversion rates, search ranking position, and review score trends. Focus on RevPAN as your primary success metric since it accounts for both rate and occupancy.
Conclusion
The occupancy trap is real and it is costing you $10,000+ per month if you manage a mid-sized portfolio. High occupancy feels good but it often masks a revenue management system that is optimized for the wrong goal.
The three STR revenue management mistakes that keep operators stuck are: setting automated pricing and ignoring it, focusing only on short-term availability instead of the full booking window, and using too many restrictions that kill bookability. Fix these three issues and you will see revenue increases of 15-35% in most cases.
Start by implementing a revenue management rhythm of one hour weekly and 15-30 minutes daily. Use that time to track market pacing data, not just your own calendar. Audit your bookability factors and remove restrictions that are not supported by data. Test changes on a few properties before rolling them out portfolio-wide.
Remember that the market average is a terrible benchmark. You are not competing against amateur hosts with bad photos and worse pricing. You are competing against your own revenue potential. The question is not “am I beating the market?” The question is “am I capturing every dollar my properties can generate?”
Want to see exactly how much revenue you are leaving on the table? Get a free Revenue Report that shows your specific opportunity. We analyze your portfolio’s booking patterns, market positioning, and bookability factors to calculate your revenue potential. This is only available for operators managing $1 million+ in annual bookings across 15+ properties.
Listen to the full conversation on revenue management strategies and learn how to implement these frameworks in your portfolio.