How to Build Accurate Short-Term Rental Revenue Projections (3 Proven Methods)
Want to build it yourself? Follow our 60-minute workshop to build an automated projection system from scratch using PriceLabs, Google Sheets, and AI.
Introduction
If you manage a short-term rental portfolio, you’ve probably faced this problem: you have no idea how much money you’ll actually make next month, let alone next quarter.
Short-term rental revenue projections are forecasts that help you predict future income with confidence. You’re stuck using last year’s numbers (which don’t account for market changes), guessing based on your current booking pace (which changes daily), or worse, just hoping things work out. Meanwhile, you need to make real decisions: Can you hire that extra cleaner? Should you sign the lease on that new property? Will you have enough cash to cover expenses during the slow season?
Without accurate revenue projections, you’re flying blind. You can’t plan investments, you can’t manage cash flow through seasonal dips, and if you’re managing for owners, you can’t give them the income visibility they need to stay with you long-term.
Here’s the good news: you can build an automated revenue projection system that updates weekly, flags potential problems before they compound, and requires zero coding experience. This article breaks down the exact three-method framework that Freewyld Foundry uses to project revenue across $190M+ in annual bookings, plus how to build the entire system using AI tools in under 60 minutes.
This framework comes from Episode 710 of the Get Paid for Your Pad podcast, where Jasper Ribbers (who co-founded Freewyld Foundry and manages pricing for 75+ clients generating $1M+ in annual revenue each) walks through the complete projection methodology.
What Are Short-Term Rental Revenue Projections?
Short-term rental revenue projections are forecasts of how much rental income your properties will generate over a specific future period (typically the next 12 months). These projections estimate your monthly or quarterly revenue based on historical performance, market seasonality, current booking pace, and remaining unbooked opportunity.
The key difference between accurate projections and guesswork is using multiple complementary methods that validate each other. When projections from different methods align, you have confidence in your forecast. When they diverge significantly (more than 20% variance), it signals a potential issue that requires investigation.
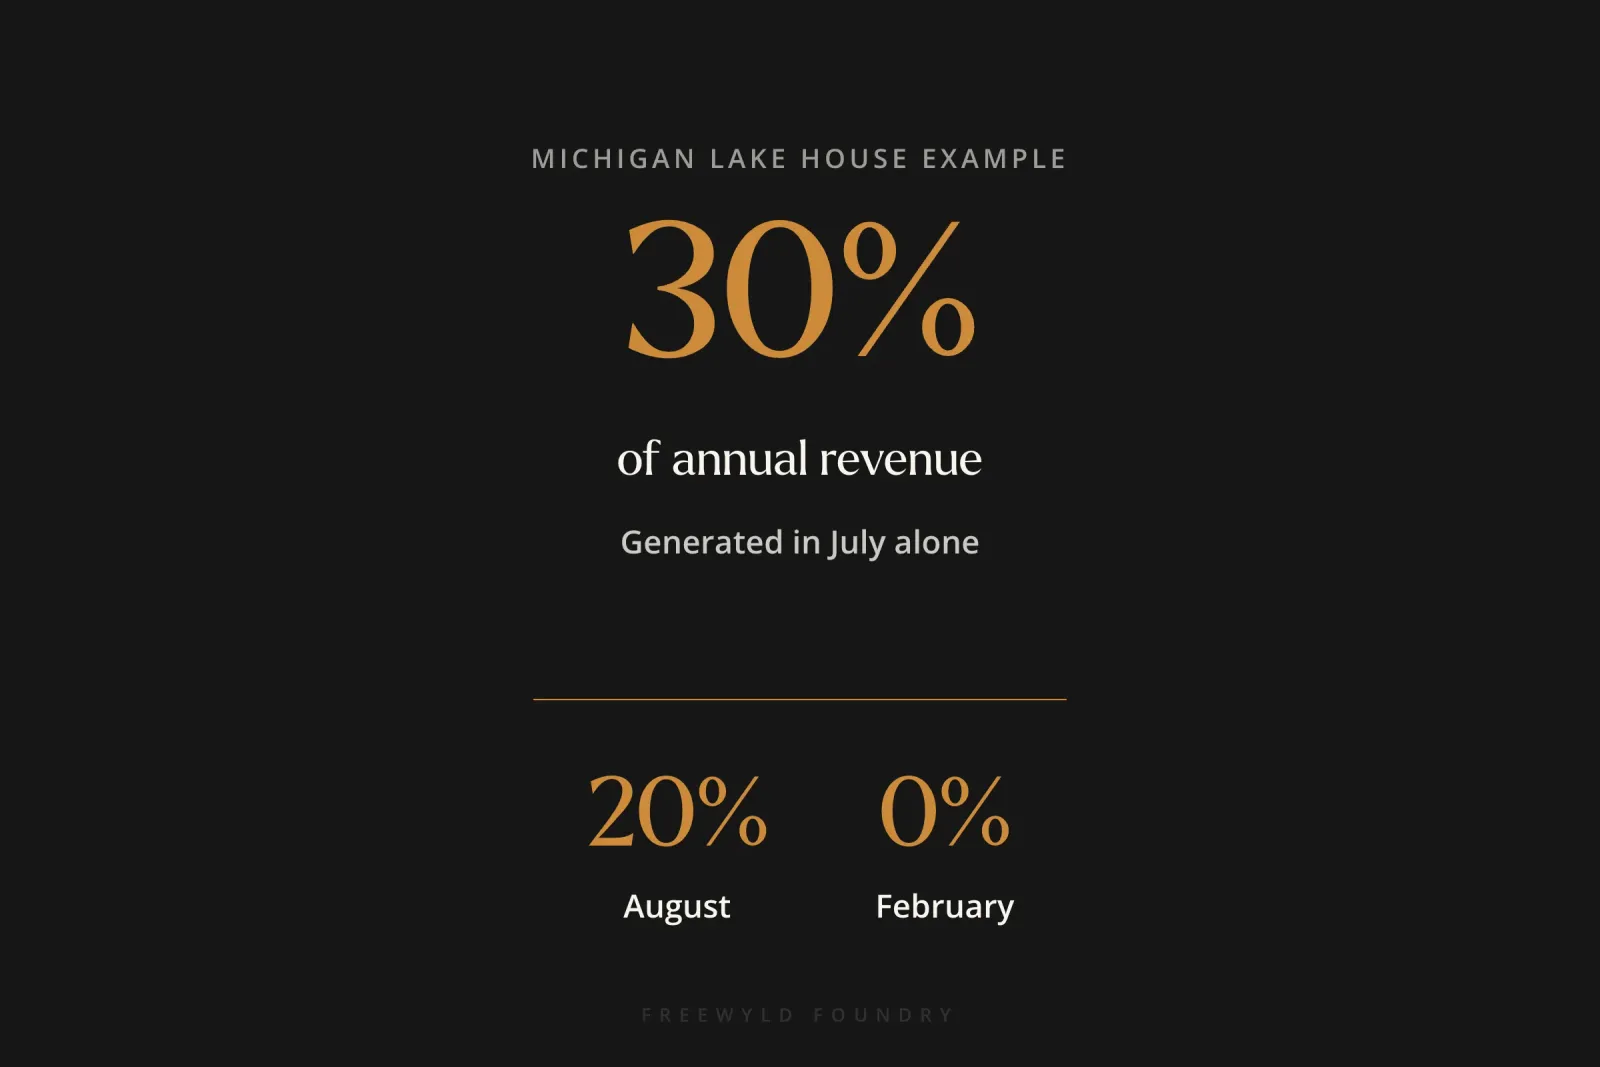
For short-term rentals specifically, projections must account for extreme seasonality. A Michigan lake house might generate 30% of its annual revenue in July alone, 20% in August, and almost nothing in February. This concentration means that cash flow projections are critical for ensuring you can cover fixed expenses (mortgage, management fees, utilities) during low season while planning investments during high season cash influx.
Why Should You Project Net Rental Revenue Instead of Total Revenue?
Most property management systems track two revenue numbers: total revenue (also called host payout) and net rental revenue (the nightly rate guests pay). Many operators focus on total revenue because that’s what hits their bank account.
This is a mistake.
Total revenue varies wildly based on factors that have nothing to do with your actual unit performance. Here’s why:
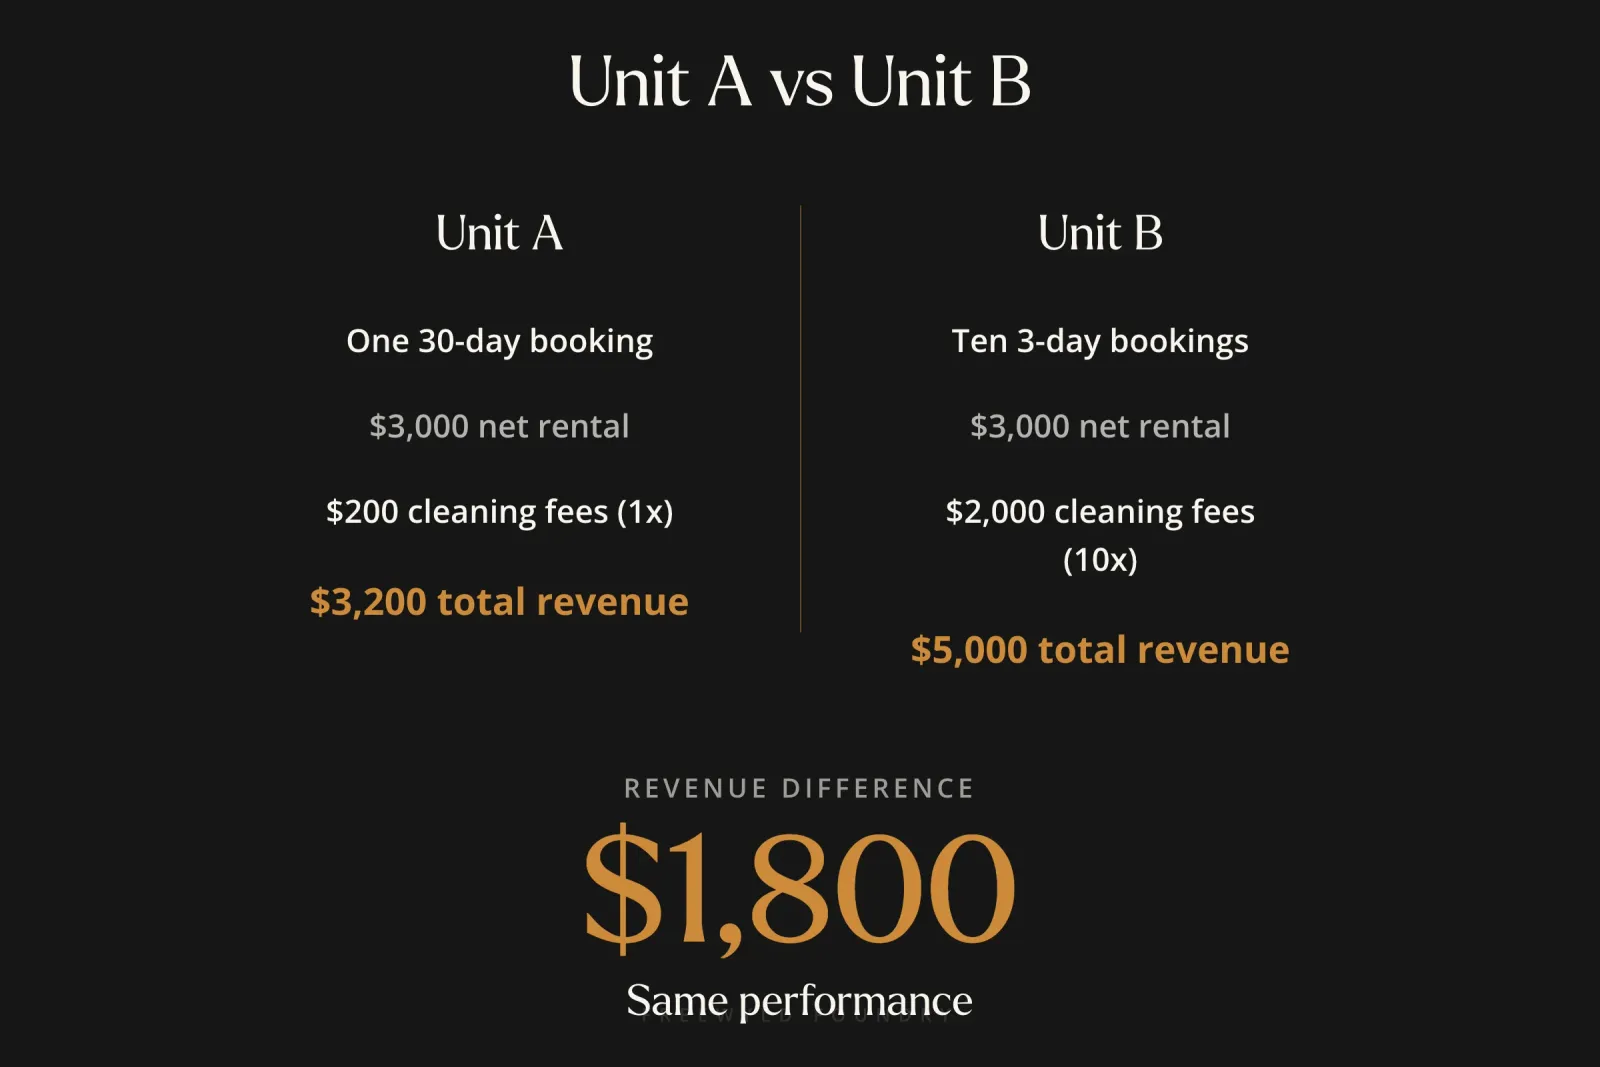
Booking Frequency Effect: Imagine two identical units. Unit A has one 30-day booking in March generating $3,000 in net rental revenue. Unit B has ten 3-day bookings in March, also generating $3,000 in net rental revenue. Unit A collects one cleaning fee (maybe $200). Unit B collects ten cleaning fees ($2,000 total). The total revenue differs by $1,800 even though the actual rental performance is identical.
OTA Commission Variations: Bookings from Airbnb, Vrbo, and direct bookings all have different fee structures. A $100 night on Airbnb might net you $88 after service fees, while the same night on Vrbo might net you $92, and a direct booking gives you the full $100. Your total revenue fluctuates based on distribution mix, not performance.
Fee and Tax Structure: Some markets require you to collect and remit occupancy taxes. Some operators charge pet fees, early check-in fees, or other ancillary charges. These all inflate total revenue but don’t reflect the core rental income that drives profitability.
Net rental revenue stays consistent regardless of these variables. It’s the cleanest metric for comparing performance across units, across time periods, and against market benchmarks. It’s also the number your profit is tied to.
According to Jasper Ribbers: “Net rental revenue is the cleanest KPI to project. And it’s also the KPI that your income, your profit is going to be mostly tied to.”
Calculating Cash Flow from Net Rental Revenue:
Once you project net rental revenue, converting to expected cash flow is straightforward:
- If you manage for owners and take a 25% commission, your gross income is 25% of net rental revenue
- If you’re doing rental arbitrage, subtract your lease cost from net rental revenue
- If you own the properties, net rental revenue minus direct operating expenses equals your cash flow
Example: $3,000 projected net rental revenue × 25% commission = $750 gross management income. Subtract your fixed costs (software, admin, marketing) to get net profit.
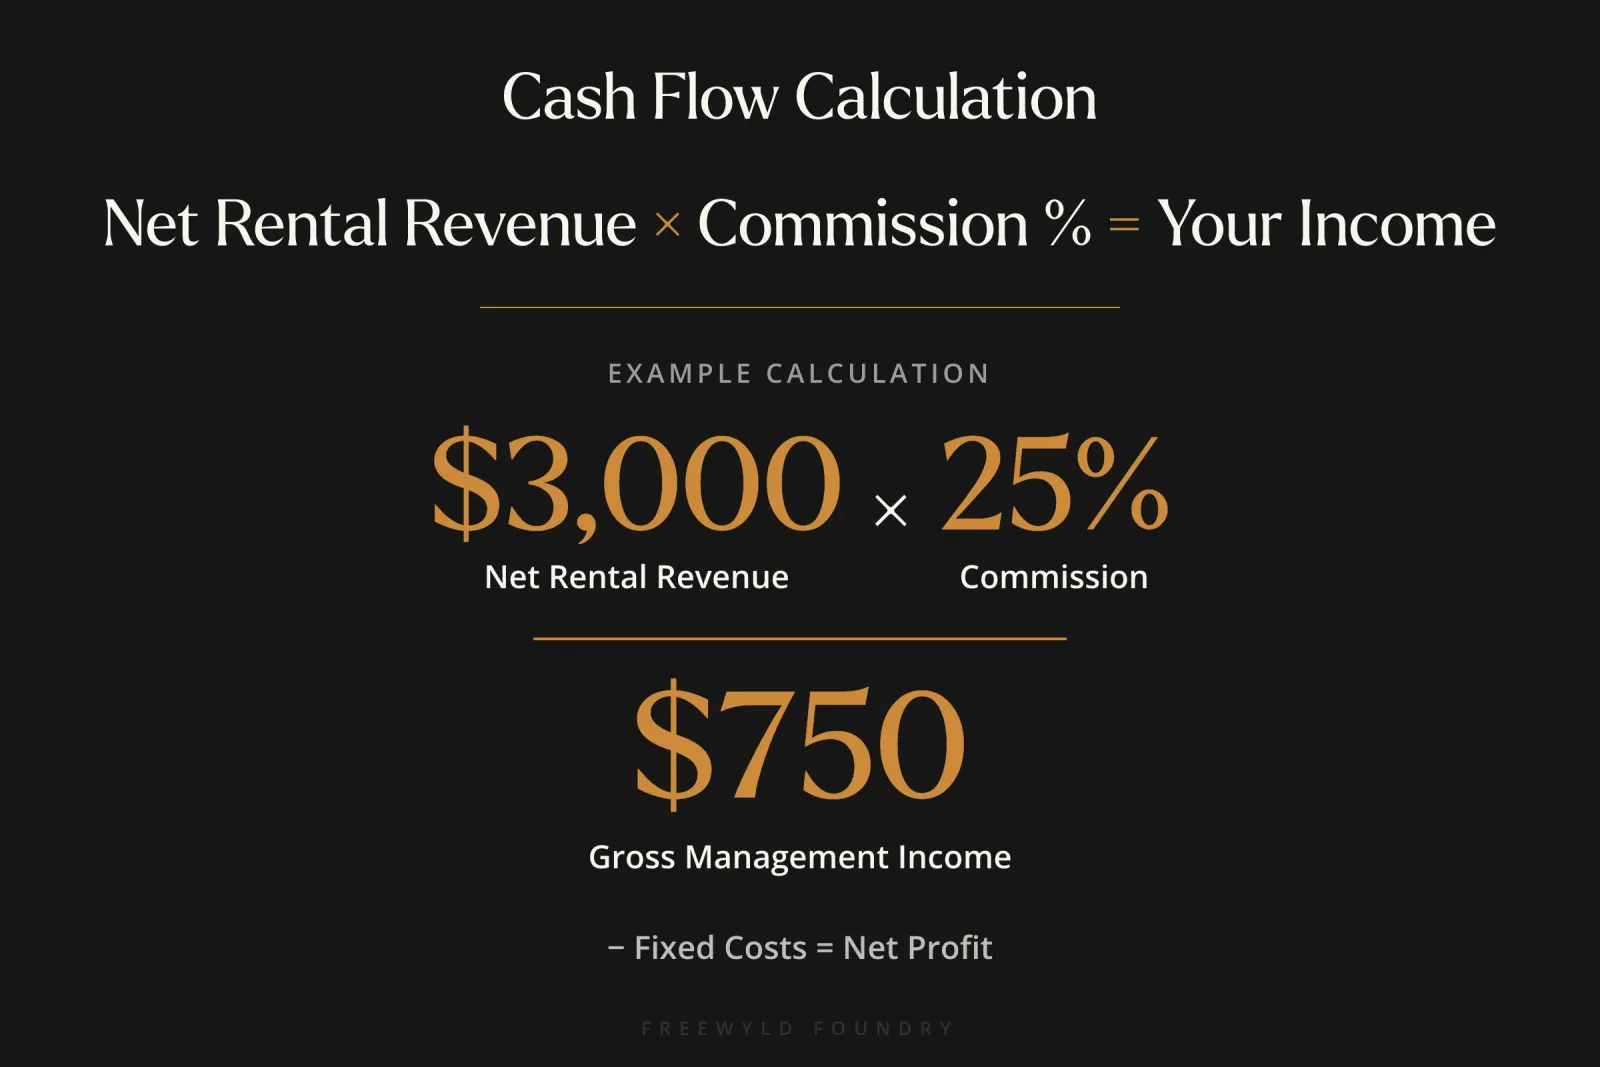
This calculation works because cleaning fees are pass-through expenses (you collect and pay them out), and the net rental revenue is what determines owner payouts and your commission split.
How Much Can Accurate Revenue Projections Improve Your STR Business?
Accurate revenue projections impact your business in three critical ways:
1. Better Strategic Decision Making
Short-term rental cash flow is brutally seasonal. You might generate 60-70% of your annual revenue in just 3-4 months, while your expenses (lease payments, management team salaries, software subscriptions) remain constant year-round.
Without projections, you can’t answer basic business questions:
- Can I afford to hire an additional team member in three months?
- Should I sign the lease on that new property opportunity?
- Will I have enough cash reserves to cover the slow season?
- When can I invest in that property upgrade or new market expansion?
With 12-month rolling projections that update weekly, you can map your expected cash flow and time major decisions appropriately. You might see that you’ll have $50,000 in excess cash in August (post-high-season), making it the perfect time to invest in three new units. Or you might see a $15,000 cash gap in February, telling you to build reserves now or delay that hire until March.
2. Improved Owner Retention and Acquisition
If you manage properties for owners, accurate projections become a powerful retention and acquisition tool.
Property owners need income predictability. They’re using rental income to cover mortgages, fund retirement, or support their lifestyle. When you can send them a monthly report showing projected revenue for the next 12 months (broken down by property for multi-unit owners), you provide value that most property managers don’t offer.
This positions you as a strategic partner, not just a service provider. It also gives owners confidence to stick with you during slower months because they can see the full annual picture, not just one disappointing low-season statement.
For acquisition, offering projection reports can differentiate you from competitors who provide only backward-looking performance reports. Operators with $1M+ portfolios (Freewyld Foundry’s target client profile) especially value this forward visibility for their own business planning and scaling strategies.
3. Early Warning System for Unit Problems
The most powerful use of projections isn’t forecasting itself, but variance analysis. When actual performance differs significantly from projections, it flags specific issues:
- Distribution problems: Unit isn’t showing up in search results on key OTAs
- Visibility issues: Photos, listing copy, or reviews need updating
- Quality/review problems: Recent bad reviews are suppressing bookings
- Pricing errors: Your pricing strategy is misaligned with market demand
Real Example from Freewyld Foundry Client:
In March, one client portfolio had every single unit performing 15-30% better than the same month last year. Except one unit. Initial analysis suggested a major problem with that property.
But when Jasper dug into the data, he discovered last year’s March had been an exceptional month for that specific unit. Someone had booked three weeks at the last minute (very short booking window) at a premium ADR because of the urgency. That’s not a repeatable pattern.
When compared to current year market performance (using RevPAR index against similar units), the property was actually performing solidly. The projection variance was due to an unrealistic baseline (exceptional prior year), not a current problem.
Without the three-method framework (described in the next section), this operator would have wasted time investigating a non-existent issue or made unnecessary pricing changes that could have hurt future performance.
What Are the Three Methods for Projecting Short-Term Rental Revenue?
Using multiple projection methods creates accuracy through triangulation. When all three methods align, you have high confidence. When they diverge, you investigate why. Here’s how each method works:
Method 1: Historical Year-Over-Year Comparison
How It Works:
Pull revenue data from exactly 12 months ago and use it as your baseline projection for the upcoming month.
If you’re projecting May 2025 revenue, look at May 2024 actual performance. If your unit generated $8,500 in May 2024, that’s your May 2025 projection (assuming no major market changes).
When to Use It:
- Unit has been active and stabilized for at least 12 months
- No major disruptions in the prior year period (owner stays, renovations, extended unavailability)
- Market conditions haven’t dramatically shifted (no major new supply, demand changes, or economic shifts)
Limitations:
- Doesn’t account for market evolution (new competitors, changing demand patterns)
- Can be misleading if prior year had exceptional bookings (like the 3-week last-minute booking example)
- Useless for new units with less than 12 months of history
- Ignores current booking pace and market signals
Best For: Stable, mature portfolios in consistent markets where you want a quick reality check against historical performance.
Method 2: Seasonality-Based Extrapolation
How It Works:
This method uses your recent performance combined with market seasonality patterns to project forward. It works even for units with limited history (as little as 2-3 months of data).
Step-by-Step Process:
-
Get Market Seasonality Data: Download seasonality percentages from PriceLabs market dashboard (or similar tool). This shows what percentage of annual revenue typically falls in each month for your market. Example: January = 5%, February = 4%, March = 7%, April = 12%, May = 15%, June = 18%, July = 25%, August = 14%.
-
Calculate Implied Annual Revenue: For each recent month your unit was active, divide actual revenue by that month’s seasonality percentage. This gives you an implied annual revenue run rate.
Example: Your unit generated $5,000 in March. March represents 10% of annual revenue in your market. $5,000 ÷ 10% = $50,000 implied annual revenue.
-
Average Across Multiple Months: Do this calculation for 3-6 recent months and average the results. This smooths out month-to-month volatility.
Example:
- November: $3,000 ÷ 5% = $60,000 implied annual
- December: $3,500 ÷ 6% = $58,333 implied annual
- January: $2,500 ÷ 5% = $50,000 implied annual
- February: $2,000 ÷ 4% = $50,000 implied annual
- March: $5,000 ÷ 10% = $50,000 implied annual
Average: $53,667 annual run rate
-
Project Future Months: Multiply your averaged annual run rate by each future month’s seasonality percentage.
Example using $53,667 annual run rate:
- April (12%): $53,667 × 12% = $6,440 projected
- May (15%): $53,667 × 15% = $8,050 projected
- June (18%): $53,667 × 18% = $9,660 projected
When to Use It:
- New units with 2+ months of data but less than 12 months
- When you want to account for current performance trends
- Markets with strong, predictable seasonality patterns
- When historical comparison isn’t available or reliable
Limitations:
- Assumes market seasonality patterns remain consistent
- One exceptional month (very high or very low) can skew the average
- Requires access to accurate market seasonality data
- Less accurate in markets with volatile or unpredictable seasonality
Best For: Newer units, growing portfolios, or situations where you want to weight recent performance more heavily than distant historical data.
Method 3: Forward-Looking Opportunity Analysis
How It Works:
This method looks at your current booking situation and projects how much of the remaining opportunity you’ll capture. It’s the most dynamic method and becomes increasingly accurate as you get closer to the target month.
Step-by-Step Process:
-
Calculate Booked Revenue: Sum all confirmed bookings for the target month. This is your floor (minimum revenue, barring cancellations).
Example: April has $4,500 in confirmed bookings as of today.
-
Calculate Unbooked Opportunity: For each unbooked night, multiply the current pricing by the number of nights available.
Example: 15 nights remaining in April, each priced at $150 average = $2,250 unbooked opportunity.
-
Estimate Market Occupancy: Research expected market occupancy for the remaining booking window. Use:
- Last year’s market occupancy data for the same month
- Current market trends from PriceLabs or similar tools
- Your historical occupancy patterns during similar booking windows
Example: Historical data shows your market typically reaches 65% occupancy in April, and you typically capture 70% of market occupancy (due to superior listing quality/reviews).
-
Calculate Expected Capture Rate: Estimate what percentage of your unbooked opportunity you’ll realistically book.
In high season with strong demand, you might capture 80-90% of opportunity. In low season, maybe 20-30%.
Example: April is shoulder season in your market. You expect to book 10 of the 15 remaining nights (67% capture).
-
Calculate Total Projection: Booked revenue + (Unbooked opportunity × Capture rate)
Example: $4,500 booked + ($2,250 × 67%) = $4,500 + $1,508 = $6,008 projected total.
When to Use It:
- High season months where you expect to book most remaining inventory
- Within 30-60 days of target month (shorter booking windows = more accurate)
- When you want to incorporate current booking pace signals
- Markets with predictable demand patterns
Limitations:
- Low season projections are volatile (one long booking can change everything)
- Requires judgment calls on capture rates (not purely data-driven)
- Less accurate far in advance (6+ months out)
- Sensitive to pricing changes (if you adjust pricing strategy, projection changes)
Best For: Near-term projections (1-3 months out), high season months with strong demand, and situations where you want to incorporate real-time market signals.
How to Combine the Three Methods for Maximum Accuracy
The real power comes from using all three methods together and comparing results.
Implementation Framework:
-
Run All Three Methods: Calculate short-term rental revenue projections using historical comparison (if available), seasonality-based extrapolation, and forward-looking opportunity analysis for each unit and each month.
-
Compare Results: Look for alignment or divergence.
Example comparison for Unit A in May:
- Method 1 (Historical): $8,500
- Method 2 (Seasonality): $8,200
- Method 3 (Opportunity): $8,400
- Average: $8,367 (high confidence due to close alignment)
Example comparison for Unit B in May:
- Method 1 (Historical): $6,000
- Method 2 (Seasonality): $8,500
- Method 3 (Opportunity): $8,200
- Variance: 42% between highest and lowest (requires investigation)
-
Investigate Variances: When methods diverge by more than 20%, dig deeper:
- Was last year exceptional (unusually high or low)?
- Has the unit’s competitive position changed?
- Are there distribution or visibility issues?
- Is current pricing strategy aligned with market?
-
Weight Methods by Context:
- 1-2 months out: Weight Method 3 (Opportunity) most heavily (50-60%)
- 3-6 months out: Weight Method 2 (Seasonality) most heavily (50-60%)
- 6-12 months out: Weight Method 1 (Historical) most heavily if available (50-60%)
-
Calculate Weighted Average: Your final projection is typically the average of all three methods, adjusted for any known factors (planned renovations, market changes, etc.).
Portfolio-Level Aggregation:
Individual unit projections can be volatile, but portfolio-level projections smooth out that volatility. When you aggregate across 10, 20, or 50+ units, exceptional performance (positive or negative) on individual units tends to average out, giving you more reliable cash flow projections for business planning.
What Mistakes Do STR Operators Make with Revenue Projections?
1. Relying on a Single Method
The most common mistake is using only one projection method (usually historical comparison). This creates false confidence because you have no way to validate whether your projection is reasonable.
Why It’s Wrong: Every method has blind spots. Historical comparison doesn’t account for market evolution. Seasonality-based extrapolation can be skewed by one exceptional month. Opportunity analysis requires judgment calls that might be wrong.
What to Do Instead: Always use at least two methods, preferably all three. When they align, you have confidence. When they diverge, you learn something important about your unit or market.
2. Tracking Total Revenue Instead of Net Rental Revenue
Operators often project total revenue because that’s what shows up in their bank account. But total revenue fluctuates wildly based on booking frequency, cleaning fees, and OTA fee structures.
Why It’s Wrong: You can’t compare performance across units or time periods when cleaning fees and booking patterns distort the numbers. Two units with identical net rental revenue might show 40% different total revenue just because one has more frequent turnover.
What to Do Instead: Project net rental revenue, then calculate expected total revenue or cash flow separately based on your typical booking patterns and fee structure. This aligns with the revenue management strategies that top operators use.
3. Ignoring Variance Analysis
Some operators create projections but never compare them to actual results. They treat projections as a one-time forecasting exercise rather than an ongoing diagnostic tool.
Why It’s Wrong: The biggest value from projections comes from variance analysis. When actual performance differs significantly from projections, it flags problems (or opportunities) that require action.
What to Do Instead: Every week or month, compare actual performance to projections. Calculate variance percentages. Investigate any unit with variance greater than 20%. Use this as your early warning system for distribution issues, quality problems, or pricing misalignment.
4. Not Accounting for Market Seasonality
Operators in highly seasonal markets sometimes project revenue by assuming consistent month-to-month performance or simple linear growth. This ignores the reality that 60-70% of annual revenue might come from just 3-4 months.
Why It’s Wrong: In a market where July generates 25% of annual revenue and February generates 3%, projecting even monthly revenue of 8.3% is wildly inaccurate. This leads to cash flow surprises and poor business decisions.
What to Do Instead: Get accurate seasonality data for your market (from PriceLabs, AirDNA, or your own historical data). Use seasonality percentages to project monthly distribution of annual revenue. Plan your cash reserves and investments around this seasonal pattern, similar to how operators maximize revenue on long weekends.
5. Treating Projections as Static
Some operators build projections once per year and never update them, even as booking pace, market conditions, and actual performance evolve.
Why It’s Wrong: Short-term rental markets are dynamic. A new competitor opening 50 units in your market, a major event cancellation, or a sudden shift in travel demand can change your projections significantly. Stale projections are worse than no projections because they create false confidence in outdated assumptions.
What to Do Instead: Update projections weekly or biweekly by downloading fresh booking data and running updated calculations. This takes minutes if you’ve automated the process (see next section on AI implementation).
How to Implement This Strategy Using AI (Even with Zero Coding Experience)
The three-method framework described above can be built in a spreadsheet, but manually updating it weekly with fresh data is tedious and error-prone. This is where AI tools (specifically Claude) become transformative.
According to Jasper Ribbers: “I spent three hours and I built an entire web app. It calculates market penetration index for a portfolio and I have zero coding experience. I’ve never used Claude before.”
Step-by-Step Implementation Guide:
Step 1: Install Claude and Set Up Your First Conversation
Claude is an AI assistant that can write code, build tools, and guide you through technical processes even if you have zero programming background. Go to claude.ai and create a free account.
Start a new conversation and give Claude context about what you want to build:
“I manage a short-term rental portfolio and want to build an automated revenue projection system. I have booking data I can export from my PMS as CSV files. I want to project revenue for the next 12 months using three methods: historical comparison, seasonality-based extrapolation, and forward-looking opportunity analysis. Can you help me build this?”
Claude will respond with clarifying questions and a suggested approach.
Step 2: Gather Your Data Sources
You’ll need access to:
- Historical booking data: Export from your PMS (Guesty, Hostaway, etc.) showing dates, revenue, unit names, and booking status
- Market seasonality data: From PriceLabs market dashboard or similar tool showing what percentage of annual revenue falls in each month
- Current pricing: Export of your current nightly rates for each unit
- Future booked revenue: Report showing confirmed bookings for upcoming months
Most property management systems can export this data as CSV files.
Step 3: Follow Claude’s Instructions to Build Your Tool
Claude will walk you through:
- Setting up the file structure
- Uploading your data
- Writing formulas or scripts to calculate each projection method
- Combining methods into a final projection
- Creating output reports (weekly updates, variance analysis, unit-level and portfolio-level views)
You don’t need to understand the code. You just need to follow instructions like “upload your CSV file here” and “copy and paste this formula.”
Total time investment: 1-3 hours for initial setup.
Step 4: Automate Weekly Updates
Once built, updating your projections takes less than 5 minutes per week:
- Export fresh booking data from your PMS
- Upload to your Claude-built tool
- Run the update process (usually just clicking a button or running a script)
- Review the new projections and variance reports
Claude can help you set up automatic data pulls from your PMS API if you want to eliminate even the manual CSV export step.
Step 5: Build Variance Reports and Alerts
Have Claude create automatic flagging for:
- Units with >20% variance between projected and actual performance
- Portfolio-level variance by month
- Cash flow projections below a threshold you set
- Booking pace that’s significantly behind projections
These become your early warning system for problems that need investigation, similar to how revenue management routines help operators stay proactive.
Example Prompt for Claude:
“I want to add a variance analysis feature. Each week, compare the actual revenue for the past month to what we projected for that month. Flag any unit where actual revenue is more than 20% different from projected revenue. Create a report showing these flagged units with the variance percentage and both the projected and actual numbers.”
Claude will write the code, create the report format, and show you how to run it.
Real-World Example: How One Operator Used Projections to Identify a Hidden Problem
One of Freewyld Foundry’s clients manages a portfolio of 25 units across a popular vacation market. In March, they ran their three-method projection framework and noticed something unusual.
Initial Observation:
23 out of 25 units were performing 15-30% better than the same month last year. The overall portfolio was up 22% year-over-year. But two units were down 18% and 12% respectively compared to last March.
First Hypothesis:
There was a problem with these two units. Maybe reviews had declined, photos needed updating, or there was a distribution issue preventing them from showing up in search.
Deeper Analysis:
When they ran the seasonality-based extrapolation method, those same two units actually projected higher revenue than the historical method suggested. This was the first clue something else was happening.
Digging into last year’s data, they discovered that March 2024 had been an exceptional month for both units. One had received a last-minute 21-day booking (very short booking window) at a premium ADR because the guest needed immediate accommodation. The other had hosted a corporate group that paid significantly above market rate.
Neither of these bookings represented typical repeatable performance. They were outliers.
Real Conclusion:
When they compared current performance to market (using RevPAR index calculations), both units were actually performing at or slightly above market averages for similar properties. There was no problem. The apparent underperformance was entirely due to using an unrealistic baseline (exceptional prior year results).
Action Taken:
Instead of wasting time investigating non-existent issues or making unnecessary pricing changes, they adjusted their projections to use the seasonality-based method more heavily for these two units (since historical comparison was misleading). They also flagged these units to watch for outlier bookings in the future.
Outcome:
Both units continued to perform well through the spring and summer. By September (six months later), year-over-year comparisons normalized because they were no longer comparing against exceptional prior year months. The projections became aligned across all three methods.
This example demonstrates why using multiple projection methods and investigating variances is so valuable. A single-method approach would have either missed the problem entirely or created a false alarm that wasted time and resources.
Frequently Asked Questions
How far into the future should I project my short-term rental revenue?
Project 12 months forward for strategic planning and cash flow management. However, confidence decreases as you project further out. Projections 1-3 months forward are highly accurate (especially using the opportunity method). Projections 6-12 months forward are useful for directional planning (hiring, investments, new unit acquisition) but should be updated regularly as new data becomes available. This aligns with effective CEO time management practices for strategic planning.
Can I use these projection methods if my units are brand new with no historical data?
Yes. The seasonality-based extrapolation method works with as little as 2-3 months of data. You need your recent revenue numbers and market seasonality percentages (available from PriceLabs or similar tools). The forward-looking opportunity method also works immediately because it’s based on current bookings and expected capture rates, not historical performance. Only the historical comparison method requires 12+ months of data.
How do I account for planned renovations or extended owner stays in my projections?
Adjust your projections manually for any known disruptions. If you’re renovating Unit A in June and it will be unavailable for two weeks, reduce your June projection by the expected revenue for those two weeks (based on your ADR and expected occupancy). Similarly, block out owner stays and subtract that revenue from projections. Update your projection tool each week as you learn about new planned disruptions. This prevents surprises similar to common revenue management mistakes.
Should I project occupancy and ADR separately or just focus on revenue?
Focus on revenue as your primary metric. Revenue is what drives cash flow and business decisions. However, projecting occupancy and ADR separately provides diagnostic value. If your revenue is up 20%, knowing whether it came from higher occupancy (demand strength) or higher ADR (pricing power) helps inform your revenue management strategy. But start with revenue projections first, then add occupancy and ADR analysis once you have the basic system working.
What if my three projection methods give me very different numbers?
This is exactly what you want to see when there’s an issue. Variance between methods flags potential problems or market changes that require investigation. Dig into the data: Was last year exceptional? Has your unit’s competitive position changed? Are there distribution issues? Is your current pricing aligned with market demand? The variance is telling you something important. Average the methods for your final projection, but spend time understanding why they diverged, similar to how you would investigate Airbnb listing suspensions.
Conclusion
Accurate revenue projections transform your short-term rental business from reactive to strategic. Instead of discovering cash flow problems when bills come due, you plan months ahead. Instead of guessing whether you can afford that next hire or new property, you map projected cash flow and make data-driven decisions. Instead of surprising owners with volatile income, you provide forward visibility that builds trust and retention.
The three-method framework (historical comparison, seasonality-based extrapolation, and forward-looking opportunity analysis) creates accuracy through triangulation while turning variance into a diagnostic tool. When projections align, you have confidence. When they diverge, you investigate and discover issues or opportunities you’d otherwise miss.
The best part? You can build this entire system in less than 60 minutes using AI tools, even with zero coding experience. Claude and similar AI assistants democratize technical capability that previously required hiring developers or spending hundreds of hours learning to code.
But short-term rental revenue projections are just the beginning. Once you learn to use AI for building projection tools, you unlock automation across your entire business: automatic action item extraction from client calls, instant task creation and assignment, data analysis that used to take hours, and tools customized to your specific workflow.
As Jasper Ribbers puts it: “AI is moving so fast that if you’re not diving into it now, like in a couple of years, you’re going to be out of business probably.”
The operators who adopt AI now, who build projection systems and automation tools, who free up 10-15 hours per week through intelligent systems, those are the operators who will dominate their markets. The ones who wait, who stick with manual spreadsheets and reactive management, will fall further behind each month as the productivity gap widens.
Want to see exactly how to build this projection system?
Watch the Part 2 video tutorial where Jasper builds the complete revenue projection tool from scratch using Claude in under 60 minutes. You can follow along step-by-step and have your own automated projection system running by the end of the hour.
Related Resources:
Listen to the full conversation: Episode 710 available on the Get Paid for Your Pad podcast
About Jasper Ribbers: Jasper Ribbers is co-founder of Freewyld Foundry, where he leads revenue and pricing management for 75+ clients managing $190M+ in annual bookings. He co-hosts the Get Paid for Your Pad podcast (700+ episodes) and teaches STR operators how to maximize revenue through data-driven pricing strategies.