
Want to outperform the market? Freewyld Foundry’s Revenue & Pricing Management service is driving an 18% performance lift for $1M+ STR operators, even in down markets. If you’re managing 15+ listings and want a free pricing audit, apply here
Most short-term rental operators are flying blind when it comes to revenue projections. They’re making critical business decisions (when to hire, which units to add, how much cash to keep in reserves) based on gut feel or simple spreadsheets that don’t account for market seasonality, booking patterns, or portfolio-level dynamics.
The result? Cash flow surprises, missed investment opportunities, and no way to spot underperforming units before they compound losses for months.
In this episode, Jasper Ribbers shows you how to build an automated revenue projection system using Claude AI in under 60 minutes, with zero coding experience required. You’ll learn the three-method framework that creates accurate forecasts through triangulation, why net rental revenue is the only metric worth tracking, and how projections function as an early warning system for unit-specific problems.
This is Part 1 of a two-part series. Next week’s episode will be a screen-share tutorial where Jasper builds the entire tool from scratch in real time so you can follow along step-by-step.
You’ll learn:
- The three complementary projection methods (historical comparison, seasonality-based extrapolation, and forward-looking opportunity analysis) that reveal discrepancies indicating unit issues or market anomalies
- Why net rental revenue is the only clean KPI for projections (unlike total revenue, which fluctuates wildly based on booking frequency and fee structure)
- How to turn projections into a red flag detection system that identifies distribution, visibility, quality, and pricing problems before they compound
- The exact formulas for each projection method, including how to calculate implied annual revenue from recent months and apply market seasonality percentages
- Why AI adoption is no longer optional (the productivity gap between adopters and non-adopters will eliminate laggards within 2-3 years, not decades like previous technology shifts)
We also talk about:
- How Jasper built a market penetration index web app in 3 hours with zero coding experience
- The cash flow management challenges created by seasonal STR revenue (low season expenses vs. high season income concentration)
- Why one client’s unit appeared to underperform until data revealed last year had an anomalous 3-week booking distorting the comparison
- The Ramp CEO’s contrarian metric (concern when employees spend less on AI credits than their salary)
- How to automate post-call action items from 10-15 minutes of manual work to 3 seconds using AI
Mentioned in the Episode:
- Revenue Management for Short-Term Rentals: Complete Guide
- How to Scale STR Revenue Management from 10 to 100+ Properties
- World Cup 2026 Revenue Playbook
Subscribe for more episodes every Monday and Friday on YouTube, Spotify, and Apple Podcasts.

World Cup 2026 Revenue Playbook
Your city-by-city pricing strategy guide for the biggest revenue opportunity in STR history. Demand tiers, team analysis, 5 costly mistakes to avoid, and an 8-step action plan.
Download Free GuideContinue Listening
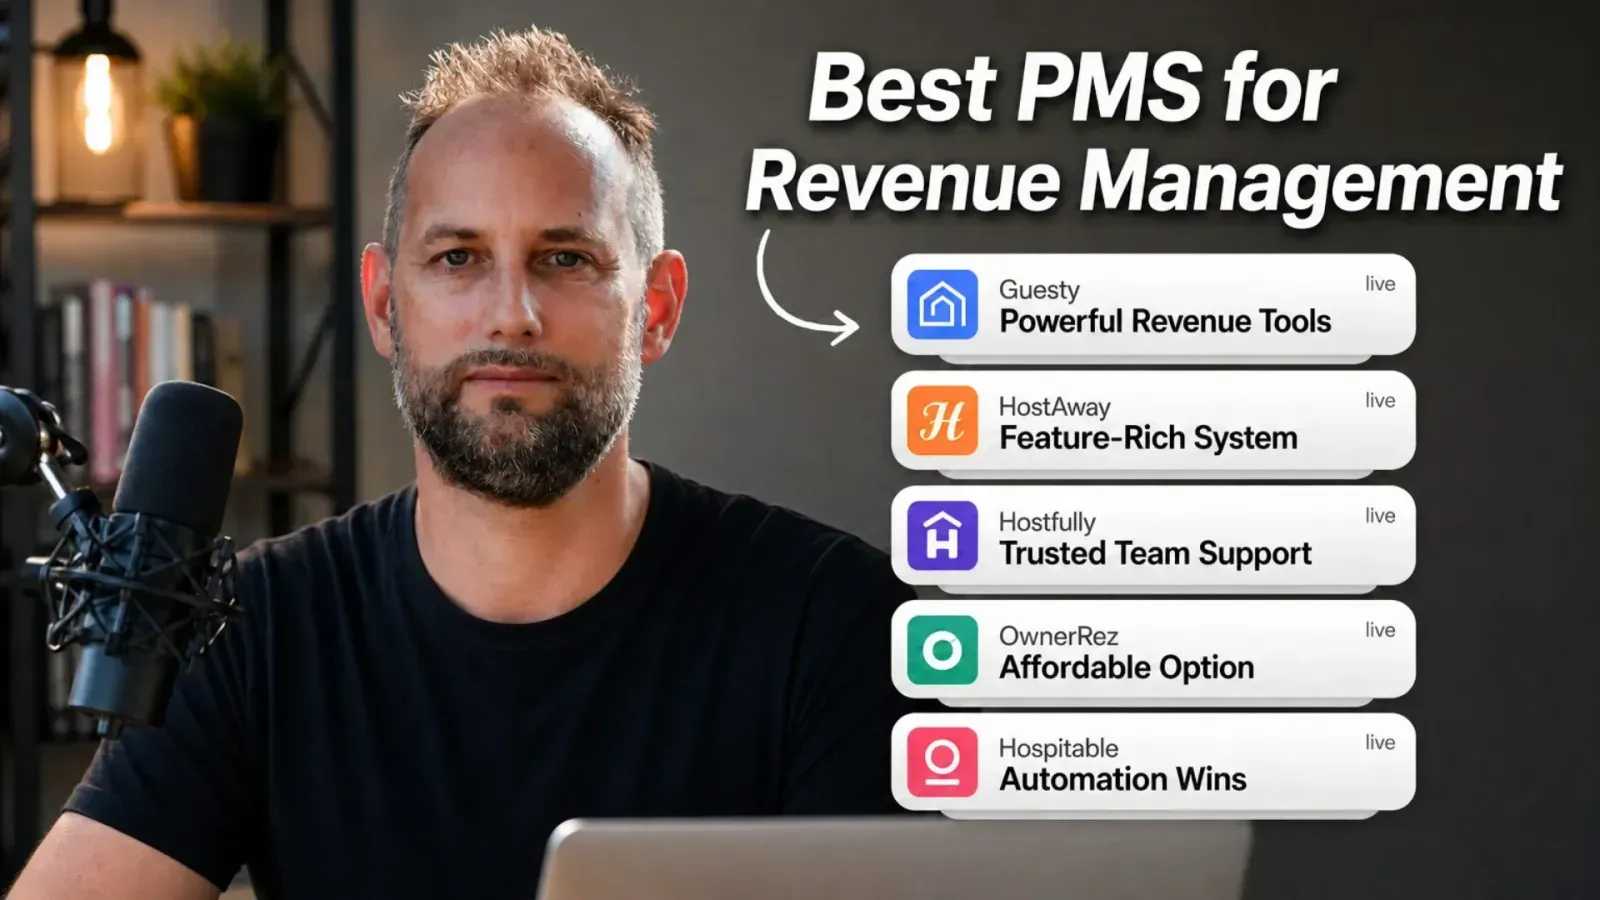
Best PMS Systems for STR Revenue Management
Jasper Ribbers manages revenue for 75+ STR companies and has worked inside nearly every PMS on the market. In this solo RevUp episode, he ranks the five systems Freewyld Foundry recommends, explains the criteria that matter most for revenue management, and covers the features that can limit your performance if you choose the wrong system.
How to Outsource Revenue Management Without Losing Control
Jasper Ribbers has reviewed over 1,000 companies applying for revenue management at Freewyld Foundry. The same costly mistake keeps coming up: operators outsource before they're set up for success. In this solo RevUp episode, he walks through the full checklist for hiring in-house or working with a service provider, including the red flags most operators miss.
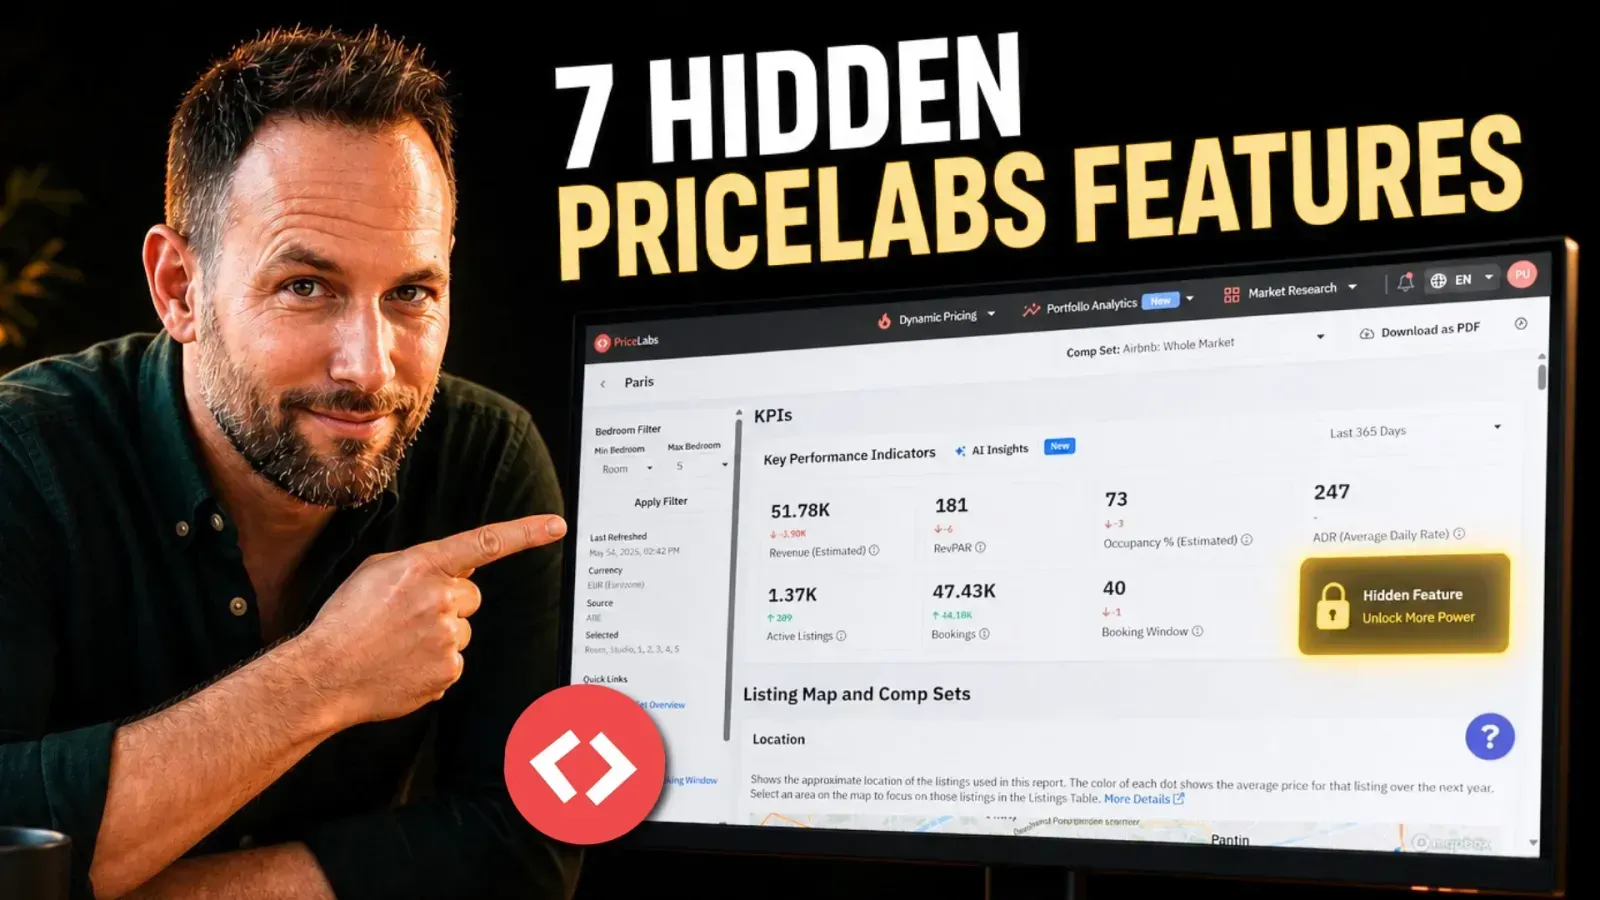
7 Hidden PriceLabs Features Most STR Hosts Don't Know
Most PriceLabs users are only scratching the surface. In this episode, Jasper walks through seven features that most operators have never used, including several that are request-only and require contacting PriceLabs support to unlock.
Why Revenue Projections Matter for Your STR Business
Jasper: If you are not on Claude, if you're not actively using either Claude or one of the other AI tools, you're going to lose out to your competition. I spent three hours and I built an entire web app. It calculates market penetration index for a portfolio and I have zero coding experience. I've never used Claude before. You know, AI is moving so fast that if you're not diving into it now, like in a couple of years, you're going to be out of business probably.
What's up everybody? Welcome back to Get Paid for Your Pad. Today, I'm going to talk about portfolio projections. So how do you project how much revenue you are going to be making with your short-term rental portfolio in the next 12 months?
I was kind of blown away by the power of Claude. When I first started using it a couple of months ago, I spent three hours and I built an entire web app to calculate market penetration index for a portfolio in the different months that were upcoming on the listing level, on the portfolio level. And literally within three hours, it was online. It was working. And I have zero coding experience. I'd never used Claude before. And I literally just started talking to Claude and basically told it, hey, this is what I'm going to do. And it basically walked me through all the steps. And it was incredible.
Building the Tool in Real Time
Jasper: So I'm going to do a part two. And part two, I'm going to share my screen. And I'm actually going to build this tool from scratch in 60 minutes or less so that you can watch the video of the next podcast. And you can literally just sit down on your computer, install Claude, and you can just follow along with what I do. And in less than an hour, you're going to have your projections build out as well.
And these projections, you can then update them every week by simply just downloading your new bookings, uploading it into Claude. And then it will adjust the projections based on the most recent data. So that way, you're going to have every week, you're going to have an updated projections, right?
I'll start now and talk about why this stuff is important. And then next week on the podcast, make sure you actually watch the video on FreeWeld Foundry YouTube so that you can go ahead and build this out for yourself. I can guarantee you that it's worth the 60 minutes that you're going to spend on it. Because not only are you going to have an amazing system, you're also going to learn how to use Claude, which is extremely powerful.
And once you've gone for this process first, it's probably going to open up the world to you when it comes to AI and the power of it. And you can then use the knowledge to build any type of tool that you want. So I think this is going to be really powerful. But yeah, for this podcast, I'm going to focus on more high levels.
The Business Case for Revenue Projections
Jasper: So number one is like, why are projections even important for your portfolio and for your units, right? Now, there's a couple of reasons why this is important. Number one is it helps your decision making in your business. Shorter rentals are seasonal. In the low season, you're not making a lot of cash, but your expenses might be the same, especially if you're doing rental arbitrage. But then in the high season is where you get most of the cash, right?
So cash flow projections are extremely important, not only to make sure that you're not falling behind and you're short on cash to pay your team members or to pay bills, but also to plan your investments. You want to know like how much cash am I going to have available in three months, in six months? When are you able to hire the next person? When are you able to invest into a new unit? These are all like really important business decisions that you have to make. And if you can predict your cash flow, then, you know, you're going to be kind of in the dark making decisions there. And your cash flow, you know, ultimately is going to come from the revenue that you generate through your STR units, right? Whether you own, you manage, or you're doing rental arbitrage. Revenue is what drives your business.
Using Projections as a Client Retention Tool
Jasper: Number two is if you are managing for owners, it's really nice to be able to send your owners a report and say like, hey, this is how much revenue we are predicting for the next 12 months for your units. And this is how much you can expect to be making. Because then your owners can also start planning their cash flow as well, right?
Your owners are probably using the income that they generate for their properties for some type of purpose. And it's also going to be very useful for them to be able to understand how much they're going to be making in the future. That could be a reason for a client to stick with you, or you could even use it as a business acquisition tool where you use it as a value add. And you might be able to sign up more clients because your competitors might not be doing this.
Projections as a Red Flag System
Jasper: Next is it's also important for revenue management. Because when you project out how much revenue you think your units are going to be making, you can then compare your projections to what the actual result was. And when there's a big difference, that might tell you something about the unit. Maybe there's an issue with the unit. Maybe there's a distribution issue. Maybe there's a visibility issue. Maybe there's a review or quality issue with the unit. Or maybe there's a pricing issue, right? Maybe you're pricing it incorrectly.
So being able to project and then compare will teach you a lot about your portfolio and your units. So it also functions as a vet flag system. If your units or your portfolio is doing significantly less than you thought it would, then you know that there's a potential issue there.
Net Rental Revenue vs. Total Revenue
Jasper: Next question is, you know, what KPIs do we really want to project? Well, first of all, of course, revenue. But there's two types of revenue. There's the net rental revenue, which is the nightly rate that the guest pays. And there's the total revenue, which is the money that you receive.
Now, these two KPIs are typically reported through Pricelabs. And Pricelabs pulls that from your PMS. So these are typically the two numbers that your PMS tracks. Now, we always prefer to project net rental revenue or rental revenue versus total revenue or host payout is another word for total revenue. I'm talking about Pricelabs here and other pricing tools. They might have different naming conventions.
But the reason that you want to project your rental revenue is that your rental revenue is not dependent on what OTA you're booking. It's not dependent on your cleaning fee. It's not dependent on any taxes or fees that you have to pay or that you add. And so it's the cleanest KPI to project. And it's also the KPI that your income, your profit is going to be mostly tied to.
Why Net Rental Revenue Is the Clearest Metric
Jasper: To give you an example why these two can differ quite a lot. Imagine that you have two units that are identical. And in one month, you have one booking for the one unit. It's a 30-day booking. And the net rental revenue is $3,000. Now, there's the cleaning fees, $200. There's a pet fee. There's all this other stuff. There's the OTA commission. Maybe you're paying sales tax. You know, depending on where you are, there's a lot of things that you might have to add and pay. But that $3,000, we can compare that to, for example, a month where for the other unit, you have 10 stays of three days each. And the net rental revenue is also $3,000.
But now you have 10 stays, so 10 cleaning fees. So your total revenue is probably going to be like five grand. So the total revenue and the net rental revenue, they're really two different things. But the net rental revenue ultimately is what defines your income and the income of your client if you're managing. Because the cleaning fee is just, that's a direct expense. You collect it, but then you pay it out to your cleaners. Unless you're making a big profit on your cleaning fees or if your cleaning fees are costing you a lot of money, then that's a different story. But the net rental revenue is the cleanest KPI to track. So that's why we prefer to project the net rental revenue.
Converting Revenue to Cash Flow
Jasper: Now, there is something to be said also to project the total revenue. It's just a little harder because of the cleaning fees. But what you can project is your cash flow based on the net rental revenue. So if you know that, like, let's say your rental revenue is $3,000 and you take a 25% commission, then that commission is going to be 25% of $3,000, which is $750, right? Obviously, you have some expenses, you know, so it's not going to be ultimately the amount that you receive. But if you know your expenses, you know your profit split, then from the net rental revenue, you're probably going to be able to calculate pretty accurately what you're going to be making and what your owner is going to be making as well.
So that's why net rental revenue, in our opinion, is the most important one to track. But you can easily, from there, you can easily calculate all the other numbers.
Other KPIs You Could Track
Jasper: You could also project the ADR, of course. You can project the occupancy. You can project anything you want, really. But in the end of the day, it all comes down to revenue, right? You can project occupancy and ADR, but that's essentially the same as tracking the rental revenue because ADR is simply occupancy times ADR.
Now, it is useful to track the other two because it could give you some information about why a unit is underperforming or overperforming. But if you see that your revenue is up 20%, it might be interesting to see like, hey, did I drive higher occupancy or is it coming from a higher ADR? All right, that will give you some information that's helpful for your revenue management. Now, other KPIs, you know, length of stay, booking window, you could project those. That's really only useful for revenue management purposes. And probably a little bit, you know, you might just want to keep it simple and start with revenue.
Method 1: Look at Last Year
Jasper: Now, there's different ways how to project your revenue. So I'm going to walk through like the different methods that you can use. So first of all, you can look at last year. If you have a unit that was active last year and it was stabilized last year, meaning it didn't start like a month before last year. So right now we're in April. If you want to project May, you know, it makes sense to look at last year in May. How much revenue did your unit make in the last year in May? And how much revenue did all your units that were active make in May?
So you can project your portfolio revenue for May, at least for the units that were active for at least 12 months. So that's obviously a very obvious data point that you want to look at.
Now, not all your units may have been active 12 months ago. Or maybe some of your units were active, but maybe there was an owner stay. Or maybe the unit was unavailable because you were doing some renovations, whatnot. So you don't always have that data point.
Method 2: Seasonality-Based Extrapolation
Jasper: So if you don't have the data point, there's other ways to project the May revenue. For example, you could look at the revenue in April and in March and in February and in January. Or you go back as far as you can. And for each of those months, you compare the revenue that the unit made to the market, the share of the revenue that falls in that particular month.
So I'll give you an example. Let's say you are in Michigan, northern U.S. And let's say that typically 30% of your profit falls in July, 20% falls in August, 20% falls in June, and then like 15% in May, maybe 15% in December, and so forth, right? And I'm making these numbers up. They might not add up to 100, but you get what I'm saying, right?
If typically the revenue in the market, let's say for March, will be 15% of the total revenue in the year, which is information that you can get easily from your pricing tool and price apps, you get it from the market dashboard. If 15% falls in March and your revenue in March for a particular unit was say, let's say $15,000, then you can simply divide that amount by 15% to get an estimate of what your yearly revenue would be based on the performance in March.
Working Through the Math
Jasper: So I said 15, but I really meant to say 5,000. Let's say it was 5,000 in March and let's say it's 10% in the market, just to make it easy. That means that your unit in March was performing at $50,000 a year. Now, if in April, typically 15% of revenue happens in your market, then you would simply multiply the 15% times the 50,000. And then your expectation would be that in March, sorry, in April, you would be doing 7,500, right?
Now, obviously, March is one month and that's only one data point. So if your unit's been active since November, then take November, take December and do the same math. And what you'll see is that the numbers are going to be slightly different. Because maybe in November, if you do the same, you apply the same method, you might get to $60,000 of yearly. And in December, it might be $55,000. And then in January, maybe it was $45,000. But if you take the average of those months, you're going to have a pretty accurate baseline of what you can expect on a yearly basis. And then you simply multiply the seasonality percentages times that yearly revenue to get projections for the individual months. So pretty simple. So that's the second method, right?
The first method is look at last year. Second method is look at recent months, extrapolate the revenue to yearly, and then multiply by seasonality.
Method 3: Forward-Looking Opportunity Analysis
Jasper: The third method, which arguably could be the most accurate one, because the first two methods, you're looking backwards. The third method is going to look into the future. So the third method, what you do is, first of all, you look at how much revenue do you have on the books? How much revenue is on the books for now, right now for April? Well, you're at least going to make that revenue unless you get cancellations.
Next, what you can do is you can look at the unbooked opportunity. So the sum of all the unbooked nights and the ADRs that you're pricing those nights at as of right now, that is your total opportunity. Now, you are probably not going to realize the entire opportunity for your units. You're probably only going to realize a percentage of that opportunity. And how much you are going to realize of the opportunity is dependent on the number of factors.
Estimating Market Occupancy in Low Season
Jasper: Number one is what's the expected market occupancy? Let's say April is a very bad month in your market. And let's say the market is only occupied 20% or your expectation is that the market will be occupied 20%. And let's say right now you have five nights booked at $100. Let's just say that all the other nights are priced at $100 too. And that's your minimum. So the price is not going to change.
So how much of the remaining $2,500 of opportunity are you going to book? Well, if the market typically is at 20% occupancy, maybe you can look at last year and see like, hey, how much publicity did I get last year? You can make an estimate and say, hey, you know what? Of the remaining 25 nights, I expect to book five or maybe six or maybe seven. That way you can also estimate how much revenue you are projecting to make.
Now, these projections in the low season can be pretty volatile. Because what happens if one person comes in and just books your unit for the entire month? You're going to make way more. So the projections are always in the low season. They are a little bit harder. There's a little bit more volatility there.
High Season Projections Are More Accurate
Jasper: Now, in the high season, it's a different story. So let's say that April is your high season. Let's say you have 10 nights left to book. And let's say the market almost books out completely. Now, you can safely assume that you're going to book up most of the opportunity. I mean, the prices are probably not going to come down very much because we're pretty close already. We're already in the month of April.
So you can make a pretty accurate estimation based on the unbooked potential, what you currently have on the books. And then having an estimate of how much you think you can book of the unbooked potential. So now we have really like we have three methods there.
Comparing Methods Reveals Issues
Jasper: Now, if we project our revenue based on all three methods and then compare them to each other, now we have a pretty solid base. Because if there's a big difference between these numbers, then that's a reason for you to dig a little deeper and see like, hey, where's this difference coming from?
To give you an example, one of my clients, one of the portfolios that I personally manage, all the units, pretty much every single unit in the market in the portfolio for March was doing like 15, 25, 20, 30% better than last year. Except for one unit. And so you look at that and you're like, hey, this unit is not really doing well. You feel like there's a problem with that unit.
But then when I looked at the data from last year, I realized that last year was just an exceptional month for that unit. Somebody came in five minutes in advance and basically booked three weeks out of the month at a really high ADR because they booked super early in the booking window. You're not going to find that person every year. That's an exceptional result that from last year.
And so it makes this year's results kind of look bleak. But if you actually, when you look at the RefBAR index, if you compare the RefBAR of the unit versus the market, if you compare the RefBAR of the unit to similar units in the portfolio, it actually turned out that it was a pretty decent month. But just because we were comparing to last year and last year was an exceptional month, it looked like there was an issue, but there really wasn't.
So when you see these discrepancies, that's a reason to dig a little deeper and you can learn a little bit more about your portfolio. You can learn about like, hey, why did this unit perform so well? Why didn't it perform well? And the same is true for the portfolio too. On the portfolio level, you're not going to see that volatility so much because obviously it kind of evens out. Like a couple of units do better, a couple of units did a little worse. Overall, hopefully the portfolio did a little better. But on a unit level, it can be pretty volatile.
Building This in 60 Minutes Next Week
Jasper: So these are the three methods. I highly recommend like combining these methods. And next week, as I'm going to literally show you how to build this out in Cloud. And within an hour, you can have a spreadsheet that's generated by Cloud that you can update on a weekly basis. I'll show you exactly what data to download. I'll start completely from scratch, right?
So I literally just open up Cloud. Cloud doesn't know anything. Well, Cloud knows a lot about what I've been doing. So it probably already knows certain things. But I'll try to make it as from scratch as possible for you. So that you can literally just follow it. And your Cloud should pretty much say the same thing as my Cloud will say.
The AI Revolution Is Here
Jasper: And, you know, just touching a little bit more on the use of AI. AI is taken off. It's incredible the power that it has right now. And I strongly believe that in the next couple of years, it's going to completely disrupt pretty much every industry. And if you're not at the front line here, if you're not jumping on this train right now, you're going to lose out to your competition.
Because the amount of productivity improvements that you can make, the amount of time that you save, and what's possible now to do in your business, what previously wasn't possible because you didn't have the resources to do so, it's a game changer. And so if you are not on Cloud, if you're not actively using either Cloud or one of the other AI tools, not just to ask questions and get information, but building spreadsheets, building tools, automating stuff, you know, there's so much possible.
Real-World Automation Example
Jasper: I'll give you one example. Like when we have a call with a client, there's always actions items, you know. And in the past, you know, we use a FEDM note taker. So the note taker will have all the action items. So we can go into our note taker, look at the action items, put them in our click up or, you know, any other task manager so that it doesn't get lost, right?
Right now, when we have a client call, FEDM automatically like creates the action items. AI will then take it. It will recognize which action items are for us and which action items are for the client. It also knows when we have the next call with the client because it has access to our calendar. It then puts a task in our click up, assigns it for the day before the next call with the client, and puts all the action items in there for not only for ourselves, but also for our client.
Like literally after the call, within three seconds, it's there. It's in click up. This saves us probably like 10, 15 minutes for every single client call that we do. It's extremely powerful.
No Excuse Not to Use AI
Jasper: And so, you know, there's really no excuse in my mind not to use AI because there's no downside. It's not expensive. It's not hard to learn because it teaches you. The AI teaches you what to do. You can ask the AI, hey, how do I use you? You just tell it what you want to achieve and it will guide you. You know, it's really incredible. It's completely blown my mind.
And AI for us at Freewell Foundry is a huge focus right now. We're investing heavily into AI, into tools, into the credits or what you call it. I can't remember the exact name, but, you know, the computer power essentially that you're buying.
The Ramp CEO's AI Spending Philosophy
Jasper: And, you know, I was listening to this podcast where I think it was the CEO of Ramp. Really good interview, by the way. If you search for it like Ramp, it's a financial product, Ramp, CEO, AI, podcast or something like that. You'll probably find it. But he was saying that he's concerned if any of his employees spend less money than their salary on AI credits. He's concerned because he's basically thinks, okay, you're not using AI enough.
If you're not spending enough on the AI tokens, I think they're called tokens. If you're not spending enough on the AI tokens, you're not using it enough. And basically that means your productivity is not what it could be.
This Isn't Like Previous Tech Shifts
Jasper: So there's really no excuse in my mind not to start using AI. And this is not something like anything in the past, any revolutionary ideas and tools and even the internet. It took years for it to really take off. I mean, the internet probably started around in the early 90s. It probably took like 10, 15, 20 years before everyone was like fully utilizing it. So you had a lot of time to adapt to it. That's not the case now.
You know, AI is moving so fast that if you're not diving into it now, like you're in a couple of years, you're going to be out of business probably. So it's really important. So just wanted to stress that.
Next Week's Tutorial
Jasper: But with that said, you know, this is it for this podcast. I highly recommend next week I'm going to release that podcast where I'm going to create that tool within 60 minutes. Highly, highly recommend. Even if you don't need property projections, just follow along with the process because you're going to learn so much more than just creating these projections. You're going to learn essentially how to use Cloud and that can just skyrocket your productivity.
So next week, guys, keep an eye out. Again, that's going to be mostly powerful to when you watch it and you follow along. So take a couple hours, block it off in your calendar, watch the video, follow along, build the tool with me. And I guarantee your mind will be pretty blown unless you're already heavily using AI and Cloud in particular. Unless you're already heavily using it, your mind is going to be pretty blown, I expect.
So with that said, thank you for listening and hopefully we'll see you next time.
Related Articles
The 5 Best PMS Systems for STR Revenue Management (Ranked)
Freewyld Foundry manages 4,000+ listings across 75+ companies worldwide and has worked inside nearly every PMS on the market. Here are the five systems we actually recommend for revenue management, and what to look for before you choose.
How to Outsource STR Revenue Management Without Wasting Time and Money
Most STR operators who outsource revenue management end up worse off than before. Here's the checklist we built after reviewing 1,000+ companies: what to have in place before you hire in-house or work with a service provider.
PriceLabs Setup Guide: 7 Hidden Features Most STR Operators Never Configure
Most PriceLabs users configure the basics and stop there. These 7 features, several of them request-only, are the ones that separate operators who are guessing from operators who are optimizing.