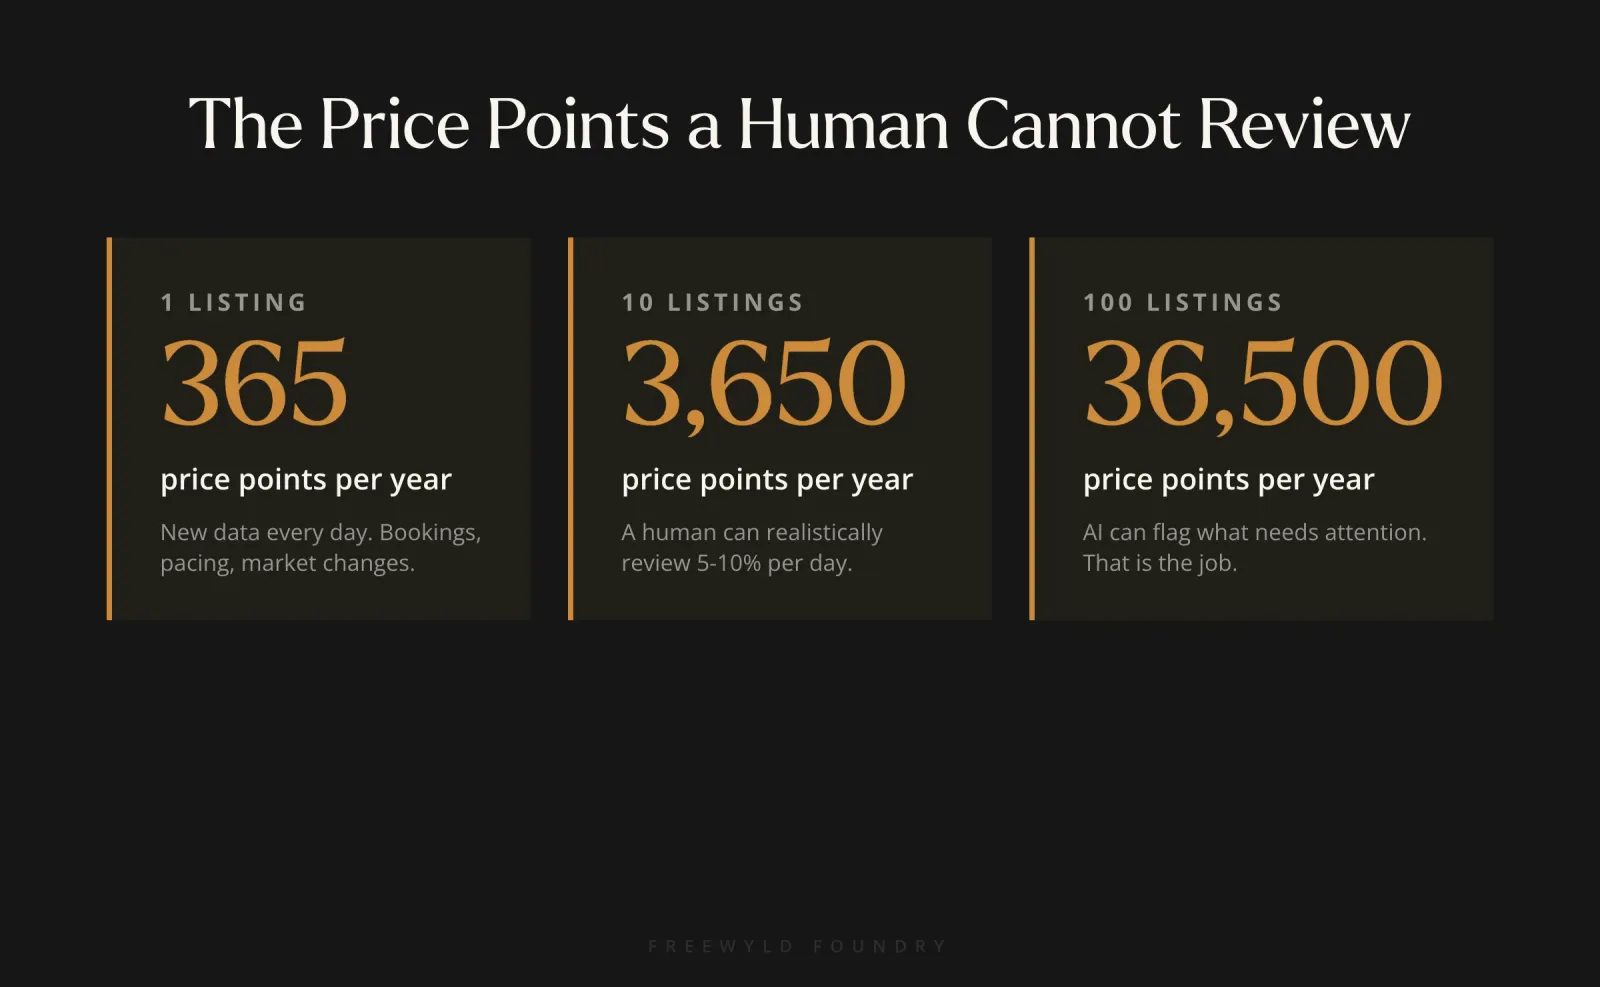
If you have 100 short-term rental listings, you have roughly 36,500 price points to manage every year. New information comes in every day: bookings, cancellations, market pacing, competitor moves. As a human, you can realistically review maybe 5 to 10% of those price points on any given day.
The other 90% go unreviewed.
That is not a failure of effort. It is just math. No person can keep up with that volume of data at the speed it changes. But AI can flag what needs attention fast enough to be useful. After managing pricing across 4,000+ properties and $200 million in annual bookings, this is the biggest gap we see between what operators are earning and what they could be earning.
Here is exactly how we use Claude to close that gap, starting from scratch, in under 30 minutes.
Key Takeaways
- A human reviewer can realistically check 5-10% of their price points per day. AI can check all of them.
- “Optimal pricing” is unknowable in advance, but you can narrow the range. The goal is flagging prices that are outside a reasonable zone.
- One CSV download from PriceLabs is all the data you need to get started.
- Asking for global comparisons first (any date vs. any date) gives you a quick sanity check. Like-for-like comparisons (weekday vs. weekday) give you a more precise picture.
- AI finds the flags. A human reviews, thinks, and decides. That division of labor is the whole point.
What AI Should and Should Not Do in Revenue Management
Before getting into the how, a clear framing on the why.
At Freewyld Foundry, we do not use AI to make pricing decisions. We use AI to help our revenue managers make better ones. That is not a semantic distinction. It shapes how you prompt the tool, how you use the output, and how much you trust the results.
What AI does well: scanning large datasets, comparing price points against historical patterns, and flagging anomalies that a human would never catch by looking at graphs. What AI does not do well: weighing the business context, understanding that a particular listing has a relationship with repeat guests who book at a certain price each year, or knowing that the market event Claude just flagged is a minor local thing that never drives bookings.
The human brings that context. The AI brings the scale. Put them together and you get better decisions than either one alone.
What “Optimal Pricing” Means
No one knows the optimal price point for a given night until after the booking happens. There are too many unknowns. The person who books is the one who tells you, in hindsight, what the price could have been.
What you can do is narrow the range. If your one-bedroom unit has never booked below $100 and never booked above $300, pricing it at $700 is almost certainly wrong. Pricing it at $10 is also wrong. The question is whether your current prices fall inside a zone where, if someone books, it is a win.
Revenue management is about scanning all 365 price points and asking: are we inside that zone, or are we outside it? AI makes that scan fast.
What You Need to Get Started
Two things: a Claude account and your PriceLabs neighborhood data. That is it.
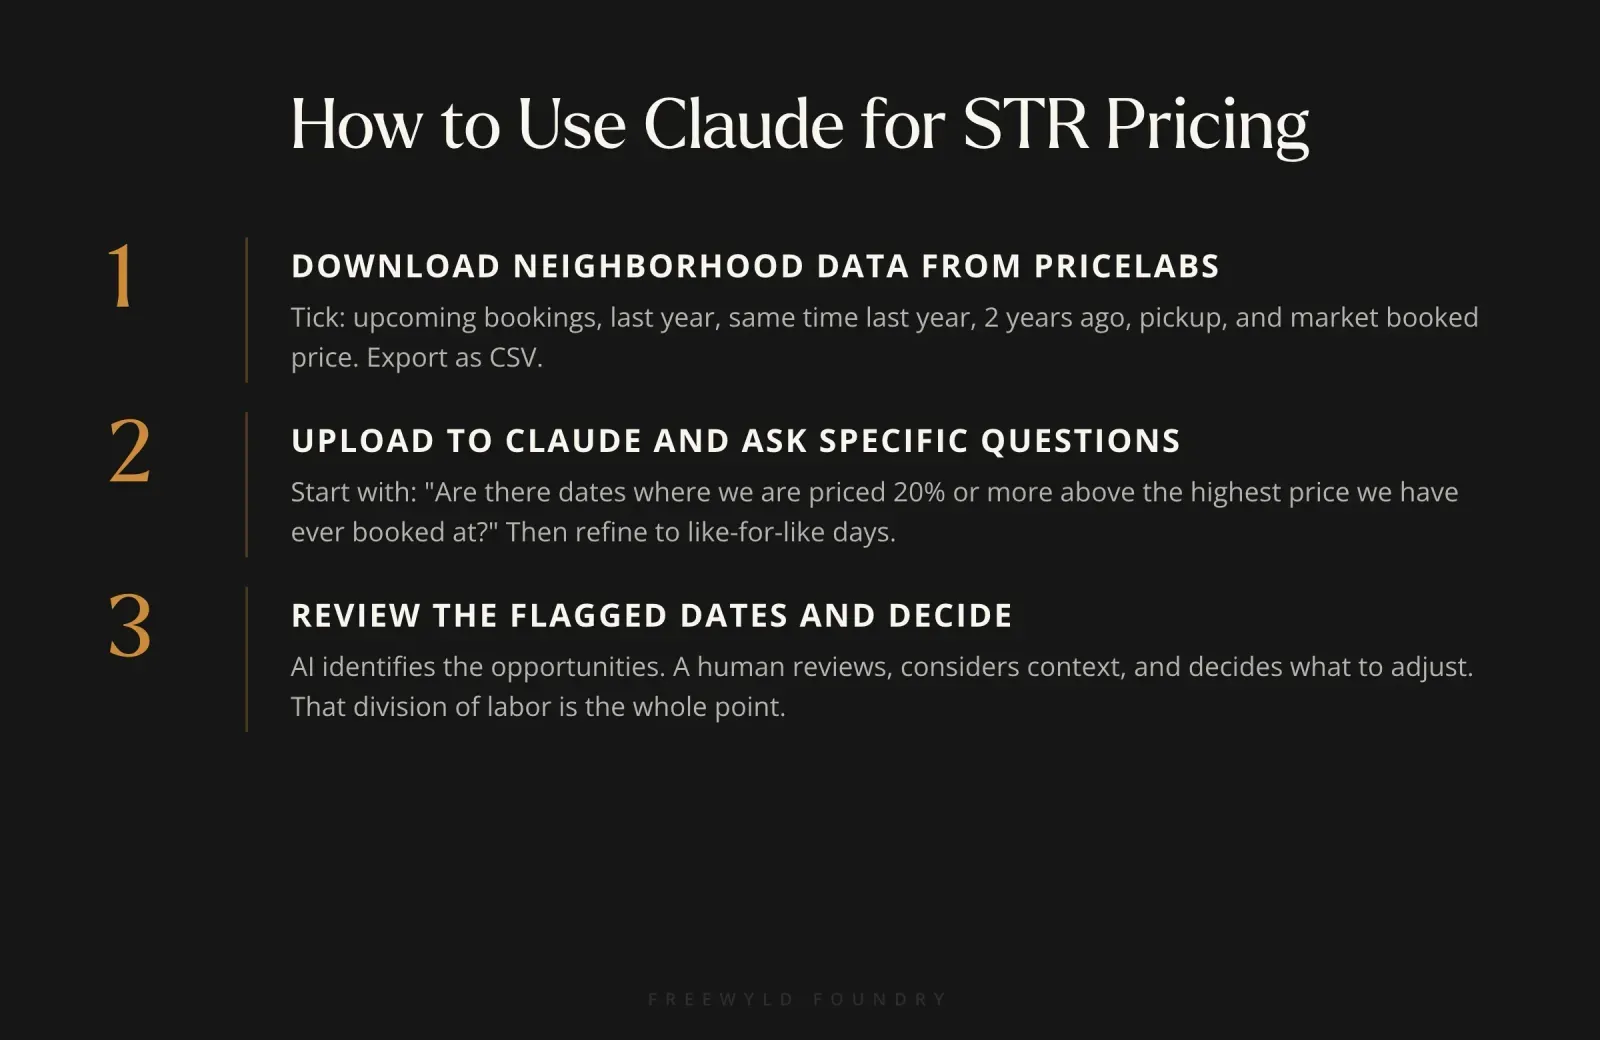
In PriceLabs, open your listing and go to the Neighborhood Data tab. Under Chart Options, make sure you have all of these selected before exporting:
- My upcoming bookings
- My last year bookings
- My same time last year bookings
- My two years ago bookings
- Last year data and pickup
- Market booked price
Click the download button and export as CSV. The whole file is under 1 MB.
Open Claude. Type: “I need your help optimizing prices for my short-term rental unit. I will give you historic pricing data and occupancy data in the market. Are you ready for the data?” Upload the CSV. Then tell Claude: “Look at the data and stop there. I will tell you what to look for. Please do not ask questions.”
That last instruction matters. Claude will try to go in its own direction if you let it. Keep it focused by giving it one specific question at a time.
Step 1: Find Your Overpriced Nights
Start with a global ceiling check. Ask Claude:
“Are there any dates where we are currently priced at least 20% higher than the highest price we have ever booked at?”
This is a simple comparison: your current prices vs. the absolute highest price point the listing has ever booked, on any date. No day-of-week adjustment, no seasonality. Just a ceiling check.
On one of our listings, Claude identified 7 nights within a few minutes. The highest price that unit had ever booked was $619. Twenty percent above that is $743. Seven nights were priced above that threshold, some by 45 to 66%. A Christmas night was at 31% above ceiling, which you could argue is worth holding since it is still far out. But five of those seven nights had no strong event justification for the markup. Those are nights that are unlikely to book at the current price.
Step 2: Refine with Like-for-Like Comparisons
The global ceiling is a starting point. The next question gives you a much more useful picture:
“Are there dates where we are priced more than 20% above the highest price a similar day has ever booked at? A similar day means weekday vs. weekday, weekend vs. weekend, and special event vs. special event.”
You are asking Claude to compare apples to apples rather than a Tuesday in November to a Saturday in July. This takes a little longer to compute, but the output is far more actionable.
On the same listing, the count went from 7 nights to 90. The breakdown: 59 non-event weekdays, 17 Sundays, 14 weekend days. That is the kind of analysis that would take a full workday manually. It took a few minutes.
One thing to keep in mind: Claude will almost always add more analysis than you asked for. It may build an Excel sheet, add a column comparing you to the market, or flag things you did not request. That is generally fine. The key is not to let it expand the scope before you have gotten what you came for. Keep your questions specific and sequential.
Step 3: Find Your Underpriced Nights
The same approach works in reverse. Ask Claude:
“Are there any nights where we are currently priced lower than the lowest price a similar day has historically booked at?”
On the same listing, Claude flagged 64 nights. Some of those will be at or near your minimum price, where there is not much room to move. Those are less interesting. Focus on the ones where there is a clear gap between your current price and the floor that has historically booked on that type of day.
Underpriced nights are easy to overlook because there is no visible problem. The calendar fills up, the revenue looks fine. But if a weekend in October is selling for $180 when similar weekends have historically booked at $240, you are leaving $60 per night on the table, silently, every time.
Step 4: Use Pacing Data to Flag Booking Gaps
Beyond price, you can also use pacing signals. Ask Claude:
“Can you identify any periods in the next 12 months where the market is already 10% or more booked and we currently have no reservations?”
This is not a pricing question. It is a diagnostic question. When the market is filling and your calendar is empty, something might be off. It could be pricing. It could be overly restrictive minimum night stay settings. It could be a listing optimization issue. In some cases, it is a blocked calendar that no one noticed.
On the same listing in this session, Claude flagged 65 nights across 16 periods. The four largest gaps ranged from 6 to 10 consecutive nights where the market was 15 to 25% booked and this listing had nothing. That is worth looking at, even if the explanation is that bookings for those dates have not come in yet.
What One 25-Minute Session Produced
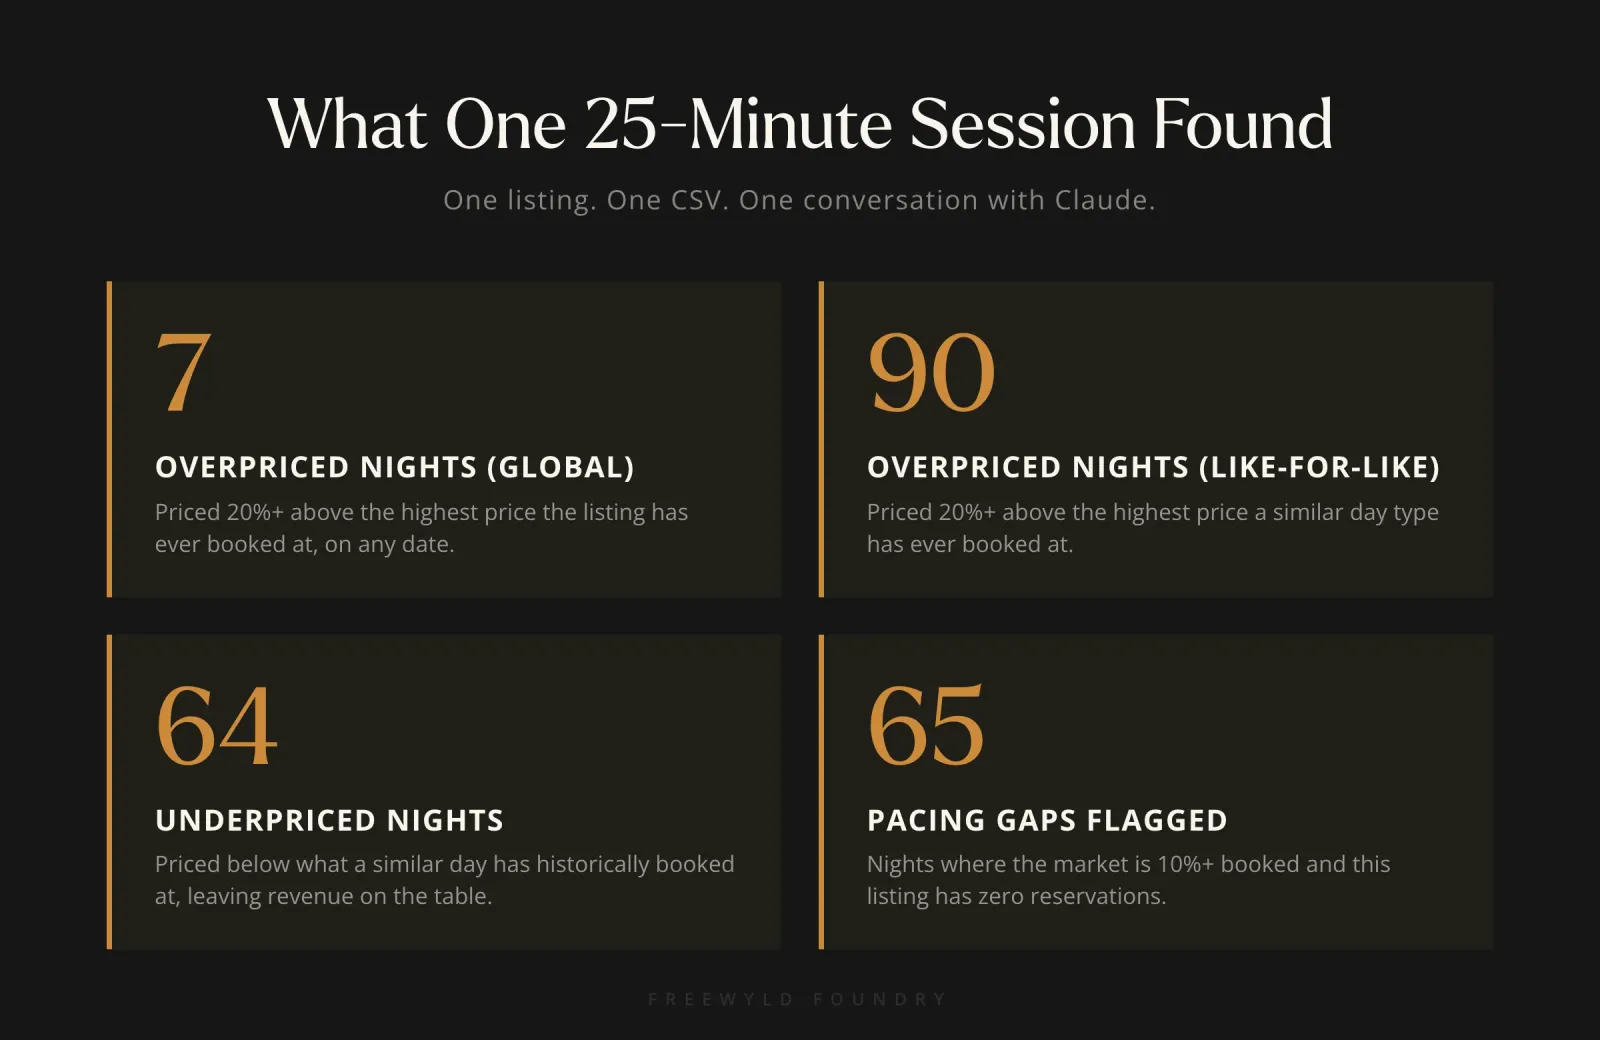
To make this concrete: in a single working session starting from scratch with one CSV file and no prior Claude setup, the analysis surfaced:
- 7 overpriced nights (global ceiling comparison)
- 90 nights flagged on a like-for-like basis
- 64 underpriced nights
- 65 nights where pacing raised a warning
Not all of those will require action. A human still needs to look at each one and decide whether the flag is real and whether the adjustment makes sense. But the difference is that now you are spending your time deciding, not hunting. The data is already organized and in front of you.
How to Get More Out of Claude Over Time
A few practical notes:
Teach it the output format you want. If you want a list of the 10 most important price points rather than a full export, say so. If you want the output as a PDF report or a simple table sorted by priority, tell it. Claude will produce whatever format you specify.
Use voice input. If you are looking at your screen mid-session and want to ask a follow-up question, click the microphone and talk to it. You do not need to type everything.
Build a Project in Claude. If you use the same data format regularly, you can create a Claude Project and include instructions about your portfolio, your preferred output format, and what to look for. The more context Claude has, the less setup you need each session.
Run the analysis regularly. The value is not in running this once. It is in running it every week or every day and letting it become part of how you identify where to spend your revenue management time.
The Human-AI Partnership
“We got to combine the AI and the human being, put them together. And as a team, they can make better decisions than a single human being or a single AI tool.”
That is the frame. Not AI replacing revenue management. AI doing the part of revenue management that a human cannot do at scale, fast enough to be useful, so the human can focus on the part that requires judgment.
The operators who get the most out of this are not the ones who try to automate everything. They are the ones who are clear about which decisions benefit from AI analysis and which ones still need a person who understands the context.
Getting those two things in the right order is the job.
Want to see what this looks like applied to your portfolio? Apply for a free revenue report at freewyldfoundry.com/get-started. We will review your pricing data and show you where the biggest opportunities are.
Listen to the Full Conversation
This article was informed by a working session on the Get Paid for Your Pad podcast.
Watch on YouTube | Listen on Spotify and Apple Podcasts