Price Labs Features You’re Not Using (But Should Be) - A Complete Guide
Introduction
You’re paying for Price Labs. You check it daily. You think you’re using it properly.
But what if I told you that 90% of Price Labs users are leaving money on the table by ignoring the platform’s most powerful features?
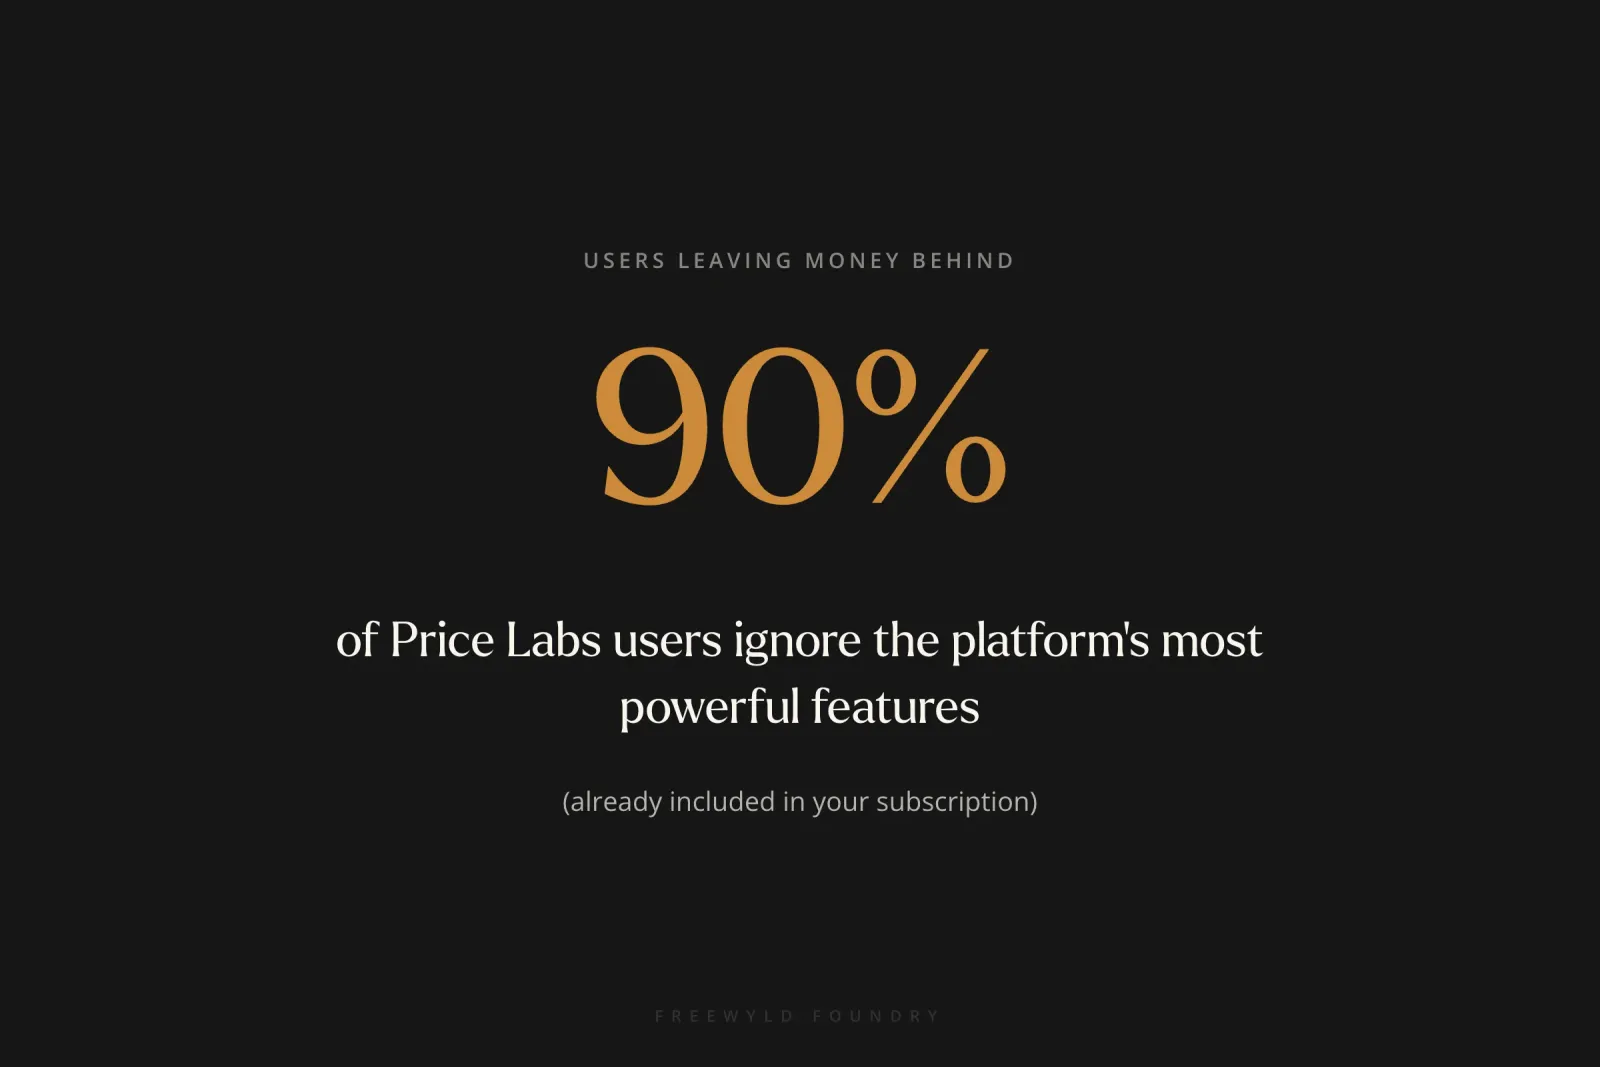
Price Labs features include advanced tools that most short-term rental operators overlook, yet these capabilities are already included in your subscription and can significantly increase your revenue. At Freewyld Foundry, we manage $190M+ in bookings across 4,000+ properties. We review hundreds of Price Labs accounts every month as part of our revenue management service, and the pattern is clear: most operators only use the basic functionality while competitors quietly leverage advanced features to capture more revenue with the same tool.
In this guide, I’ll walk you through seven underutilized Price Labs features that can transform your pricing strategy. These aren’t paid add-ons or premium features. They’re already included in your subscription. You just need to know where to find them and how to use them.
What Is the Market Dashboard in Price Labs?
The market dashboard is Price Labs’ competitive intelligence tool that shows you exactly how your market is performing in real-time.
Every single Price Labs user gets one free market dashboard credit. Yet when we review operator accounts, we consistently find this credit unused. That’s like paying for a gym membership and never walking through the door. showing exactly where you’re leaving money on the table.
How Do You Clean Up Inactive Listings in Price Labs?
Dirty data creates blind spots. If you have listings in your Price Labs account that are no longer syncing (properties you stopped managing, seasonal closures, or temporarily offline units), they’re polluting your KPIs and making accurate performance tracking impossible.
Here’s the problem: when you view your KPI dashboard or reporting section, Price Labs includes everything currently visible in your account. Those inactive listings show up in your averages, occupancy rates, and revenue numbers. To get accurate data, you have to manually filter to “sync on” listings every single time.
The Hidden Listing Feature
The solution is simple but often overlooked: hide inactive listings.
Step 1: Navigate to Dynamic Pricing, then Manage Listings Step 2: Identify any listings marked as “not syncing” Step 3: Click the “Hide Listing” button for each inactive property
Once hidden, these listings disappear from your dashboard, multi-calendar view, KPI section, and reporting. Your data becomes clean and actionable.
Don’t worry about losing data. If a listing is still in your PMS and you want to reactivate it later (even a year later), you can pull it back into Price Labs without losing any historical information.
What Is Combined Listings Functionality?
If you rent out a duplex (entire house plus individual floors), a compound (village plus individual cabins), or any multi-unit configuration, combined listings functionality is essential for accurate performance tracking.
The Multi-Unit Problem
Let’s say you have four cabins that you rent individually. You also offer the entire property as “The Village” for larger groups. When someone books The Village, that master booking generates significant revenue. But in your reporting, that revenue only appears under The Village listing, not the individual cabins.
The result? Your cabin KPIs look artificially low. When you compare to last year, it appears your individual cabins are underperforming. But the real story is that you simply had more master bookings this year.
How Combined Listings Works
Combined listings functionality allocates master booking revenue and metrics back to the individual sub-listings. This gives you accurate year-over-year comparisons and true performance metrics for each unit.
This is a request-only feature (no extra cost), meaning it won’t appear in your Price Labs account by default. Contact Price Labs support and ask them to activate it. Once enabled:
Step 1: Go to Manage Listings, then Combined Listings Step 2: Select your master listing first Step 3: Select all sub-listings that comprise the master Step 4: Save the configuration
Now when The Village books, Price Labs automatically distributes that booking’s revenue, occupancy, and ADR across the four individual cabins. Your performance tracking becomes accurate and actionable.
How Do You Customize Multi-Calendar Metrics in Price Labs?
The multi-calendar section is where most operators spend the majority of their time in Price Labs. It’s your command center for pricing decisions. Yet most users never customize it beyond the default view.
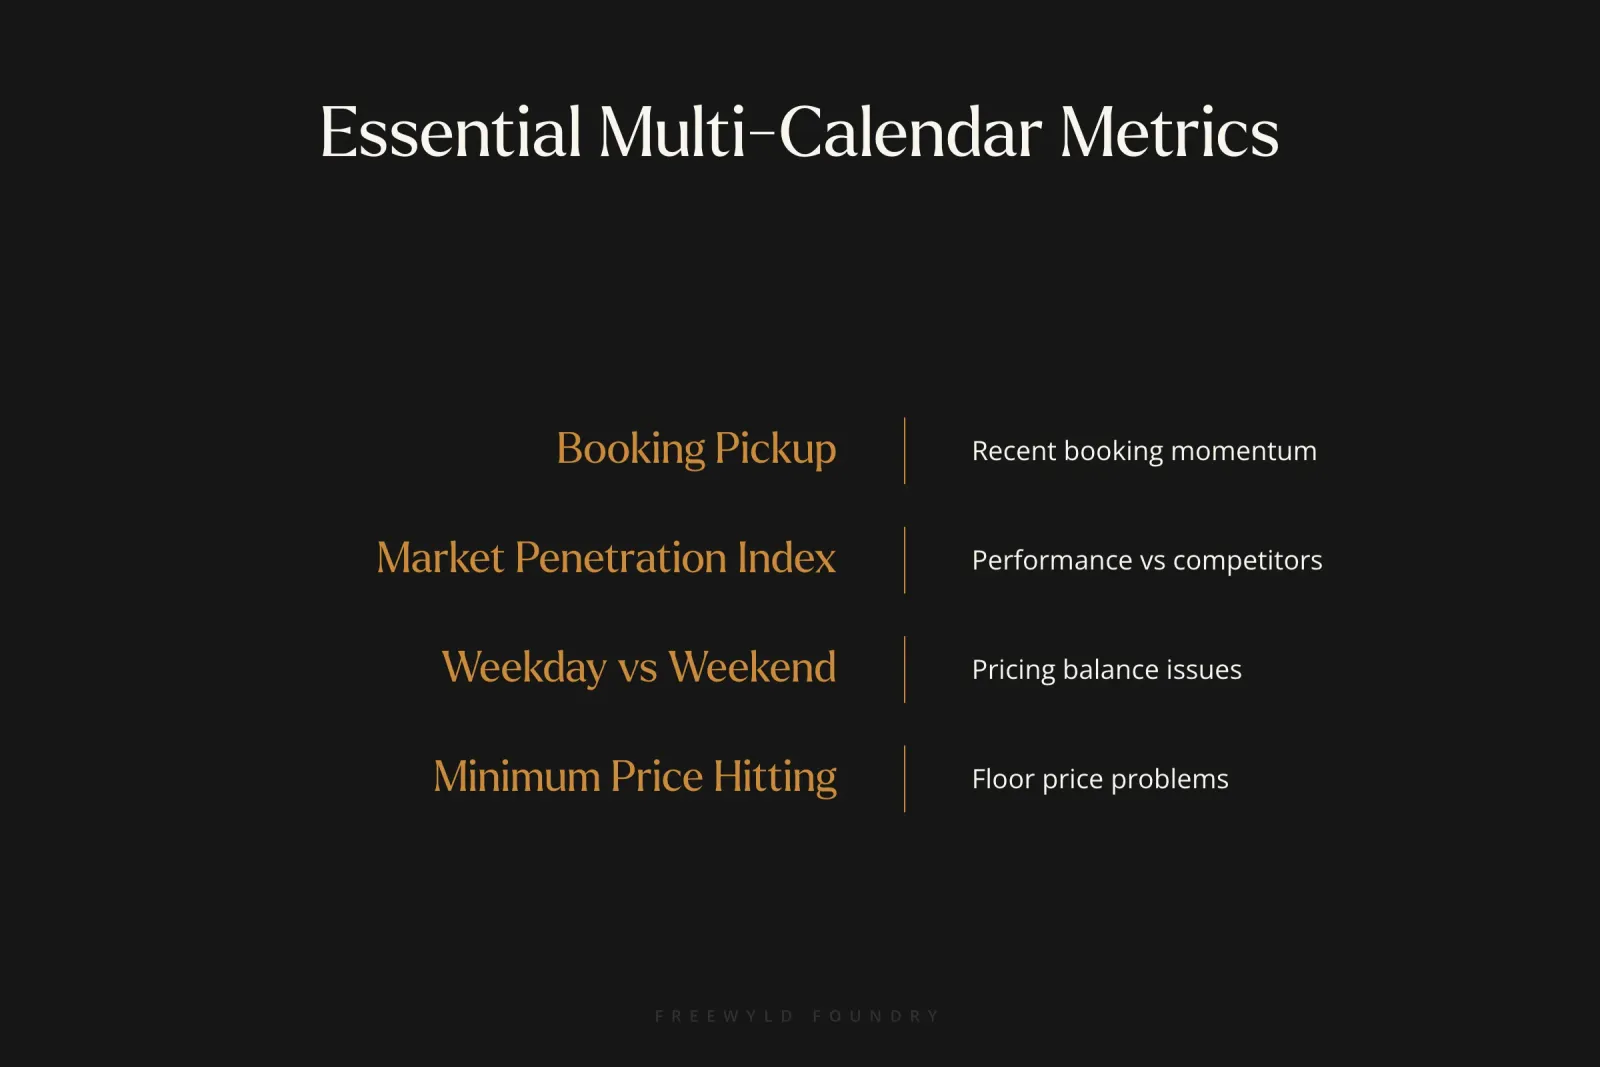
Essential Metrics Beyond Occupancy
Price Labs defaults to showing basic forward occupancy (next 15, 30, 60 days). While useful, this barely scratches the surface of available metrics.
| Metric Type | What It Reveals | Recommended Time Period |
|---|---|---|
| Booking Pickup | How many bookings came in recently | 7-day and 15-day |
| Market Penetration Index | How you’re performing vs comp set | 60-day or 90-day |
| Weekday vs Weekend Occupancy | Pricing balance between mid-week and weekends | Current + forward |
| Minimum Price Hitting Dates | Whether your minimums are set correctly | Next 60 days |
Understanding Booking Pickup
Booking pickup metrics show you momentum. A 7-day pickup of zero bookings across multiple listings signals a potential pricing problem. A sudden spike in 15-day pickup indicates you’ve hit the right price point or market demand has shifted.
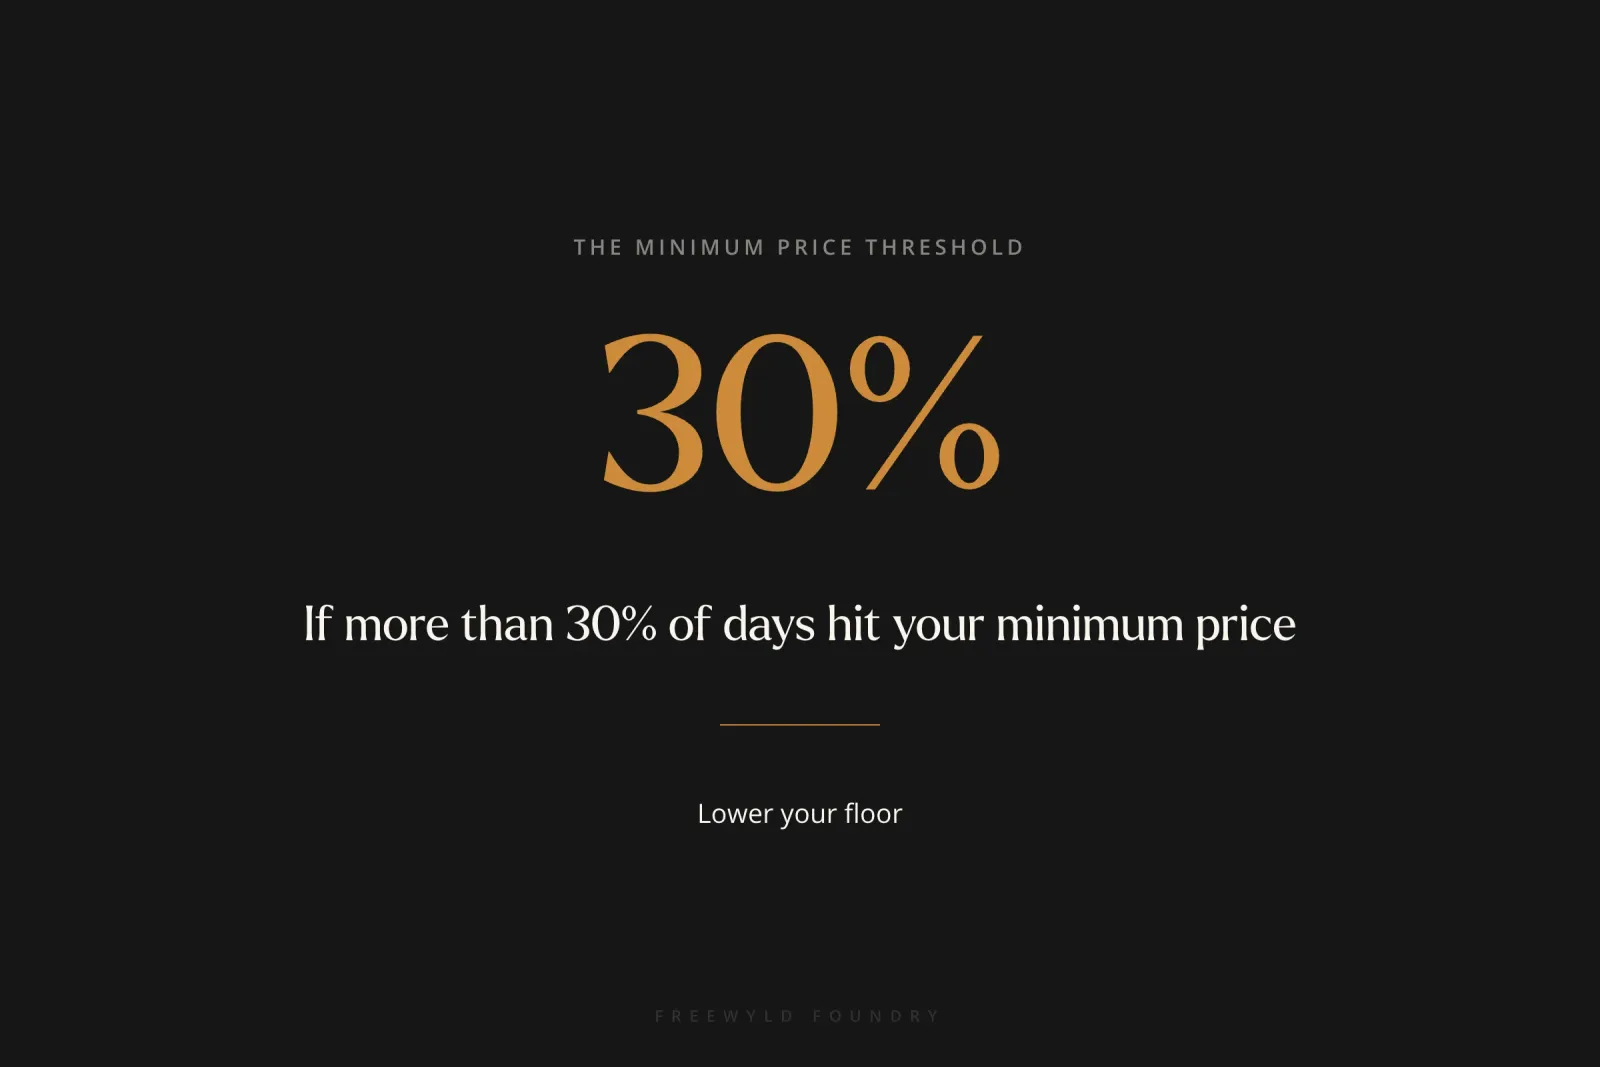
The 30% Minimum Price Rule
“If your minimum prices are too high, then you’re gonna see a high percentage of days hitting that minimum. So if it’s anywhere above like 30% or so, you probably want to lower your minimum a bit,” explains Jasper Ribbers.
This metric prevents you from setting floor prices that actually act as ceiling prices, limiting your revenue potential. Operators who properly calibrate their minimum night stay rules using this Price Labs feature often see immediate booking improvements.
Customizing Your View
To add metrics to your multi-calendar:
Step 1: Navigate to Dynamic Pricing, then Multi Calendar Step 2: Click “Add Metrics” Step 3: Select your desired metric from the dropdown Step 4: Choose the time period Step 5: Click add (repeat for additional metrics)
There’s no limit to how many metrics you can add. The key is selecting metrics that inform specific decisions rather than adding everything and creating information overload.
What Calendar Settings Should You Enable?
Beyond metrics, the multi-calendar has display settings that most operators never touch. Click the gear icon on the right side of the screen to access calendar settings.
Display Options to Enable
Turn on all of these:
- Show child listings (for multi-unit properties)
- Minimum night days (reveals booking restrictions)
- Booking info (shows booking details on hover)
- Accounts and group dates
- Specific overrides (shows where you manually adjusted prices)
- Highlight minimum and maximum price dates (visual indicator)
- Add events and holidays (context for demand spikes)
Understanding Color Modes
Price Labs offers three calendar color schemes:
1. Demand Mode (Default)
- Green indicates high demand dates
- Blue indicates low demand dates
- The default and most commonly used view
2. Recommended Price vs Last Year ADR
- Red dates are priced lower than last year’s ADR for that date
- Blue dates are priced higher than last year
- Gray dates have no last-year data available
- Use this view to ensure you’re not accidentally pricing below last year
3. Reservation Dates Mode
- Shows only booked dates
- Darker blue means more recent booking
- Lighter blue means booked further in advance
- Useful for understanding booking window patterns
Performance Optimization
Set your maximum number of days to 90. While you can view up to 365 days, limiting to 90 makes the calendar load significantly faster, especially if you have many listings.
Consider enabling “high contrast color mode” if the default green and blue don’t provide enough visual distinction. This changes colors to yellow, orange, and green for clearer differentiation.
How Do You Choose the Right Comp Set Size?
Your comp set determines what properties Price Labs compares you against for pricing recommendations and market insights. Most operators set it once and never revisit it. That’s a mistake.
The Studio Comparison Paradox
Conventional wisdom says match bedroom count exactly. If you have a studio, compare to studios. If you have a three-bedroom, compare to three-bedrooms.
But this creates a problem when your specific bedroom count has limited inventory in the market. For example, in Idyllwild there are only 18 studios. If you compare your studio only to those 18 listings, you get extremely volatile data.
“If a big group comes in and books up like 10 studios in the market, that’s half of the inventory. And so that one group can literally occupy half of the market,” notes Jasper Ribbers.
The 50-100 Listing Sweet Spot
Instead of exact bedroom matching, aim for 50-100 comparable listings in your comp set. This provides enough data to smooth out randomness while remaining relevant to your property.
For a studio, adding one-bedrooms to your comp set (bringing the total from 18 to 72 listings) produces dramatically smoother, more actionable data. The future occupancy graph transforms from spiky and erratic to smooth and interpretable.
When Exact Matching Matters
The exception: properties with very different booking windows. Don’t compare a five-bedroom (typically booked by large groups with long lead times) to one-bedrooms (often last-minute individual travelers). The booking behavior is too different to provide useful insights.
But a studio and one-bedroom? Very comparable. A three-bedroom and four-bedroom? Also fine to combine.
Creating Custom Comp Sets
If your property is truly unique (luxury estate, unusual configuration, specific location), you can create custom comp sets using the market dashboard:
Step 1: Go to your market dashboard Step 2: Manually select specific comparable properties Step 3: Save as a custom comp set Step 4: Apply that comp set to your listing
Only do this if you have a strong reason. Manual comp set creation is time-consuming and often doesn’t provide significantly better insights than the automated nearby listings selection with expanded bedroom counts.
How Do You Use the Neighborhood Data View?
The neighborhood data view is the most powerful single screen in Price Labs for making pricing decisions. Yet it’s buried behind a three-dot menu, so many operators never discover it.
Accessing Neighborhood Data
From your multi-calendar view:
Step 1: Find the listing you want to analyze Step 2: Click the three dots menu Step 3: Select “Neighborhood Data”
This opens a comprehensive view showing how your listing compares to your comp set across time.
Understanding Chart Options
Click “Chart Options” to customize what information appears on the graphs. Essential selections include:
- Last year’s data (shows your performance same time last year)
- Pickup (shows recent booking velocity)
- Market book price (shows what the comp set is actually booking at)
- Events and holidays (provides context for demand spikes)
Set aggregation to “Daily” for most use cases. Monthly aggregation is useful for high-level trend analysis but obscures important day-to-day pricing nuances.
The Two Critical Graphs
Future Prices Graph Shows your current pricing compared to:
- Your comp set’s average price
- Last year’s prices for the same dates
- Your upcoming booked nights (with ADR shown)
Use this to identify pricing gaps. If your comp set is consistently $50 higher than you are, you have room to raise prices. If you’re consistently higher but not booking, you may need to adjust.
Future Occupancy Graph Shows occupancy on the books for your listing versus:
- Comp set average occupancy
- Last year’s occupancy at this same point
- Last year’s final occupancy
“The future occupancy graph is gonna look a lot more insightful because there’s a lot more data. It’s not gonna be as spiky. It’s much more smooth,” says Jasper Ribbers.
Reading Pacing Data
Pacing tells you whether you’re ahead or behind schedule:
- Green line (you) above blue line (comp set) = you’re capturing more than your share
- Green line below blue line = you’re lagging the market
- Compare current pickup to last year’s same-time pickup to understand momentum
If March shows 21% occupancy 33 days out, but January and February showed 28% and 29% at the same point, March is pacing behind. This signals you may need to adjust your strategy for that month.
Frequently Asked Questions About Price Labs Features
Do market dashboards cost extra money?
Every Price Labs user gets one free market dashboard. If you want additional dashboards for multiple markets, pricing ranges from $9.99 to $39.99 per month depending on how many listings you include in each dashboard. A dashboard with 3,000+ listings (typically sufficient for most markets) costs $9.99 per month.
What happens if I delete a listing from Price Labs?
If the listing still exists in your PMS, you can always pull it back into Price Labs later without losing any historical data. Price Labs retrieves the data from your PMS, so deleting from Price Labs doesn’t delete the underlying information.
How many comparable listings should be in my comp set?
Aim for 50-100 comparable listings in your comp set. Under 50 creates too much volatility from random bookings. Over 100 is fine but may dilute relevance if you’re including properties that are too different from yours. The key is balancing data volume with property similarity.
Should I use demand mode or price comparison mode on my multi-calendar?
Use demand mode as your default daily view. Switch to “Recommended Price vs Last Year ADR” periodically (weekly or monthly) to ensure you’re not accidentally pricing below last year’s performance. Use reservation dates mode when analyzing booking window patterns.
How often should I check the neighborhood data view?
For actively managed properties, check neighborhood data at least weekly, and more frequently (2-3 times per week) during high season or when making significant pricing changes. This view reveals whether your pricing adjustments are working or need further refinement.
Can Price Labs features help prevent listing suspensions?
While Price Labs primarily handles pricing, proper use of its features helps you maintain consistent occupancy and revenue performance, which supports the operational systems needed to prevent Airbnb listing suspensions. Accurate pricing reduces last-minute scrambling that can lead to guest experience problems.
How do Price Labs features compare to hiring a revenue manager?
Price Labs provides powerful data and automation, but choosing the right revenue manager involves strategic thinking that goes beyond any software tool. The best approach combines Price Labs features with either in-house expertise or an experienced revenue management partner.
What Price Labs features matter most for large portfolios?
For operators scaling STR management companies, the combined listings functionality, multi-calendar customization, and neighborhood data views become essential. These features let you spot performance issues quickly across dozens or hundreds of properties.
Conclusion
Price Labs contains powerful revenue management tools that most operators never use. The seven features covered in this guide (market dashboards, hidden listings, combined listings, multi-calendar metrics, calendar settings, comp set optimization, and neighborhood data) are all included in your existing subscription.
“None of these features that I’ve walked through, none of them cost any additional money. This is all included in your Price Labs membership,” confirms Jasper Ribbers.
The difference between operators who capture their full revenue potential and those who leave money on the table often comes down to knowing which buttons to push and which data to trust. Understanding Price Labs features thoroughly transforms your ability to make confident pricing decisions based on market data rather than guesswork.
Start with the market dashboard. Use your free credit today. Then work through hiding inactive listings, customizing your multi-calendar metrics, and optimizing your comp sets. The neighborhood data view should become your daily command center for pricing decisions.
Want expert analysis of your current Price Labs setup?
→ Get a free personalized revenue report showing exactly where you’re leaving money on the table.
Related Resources:
- 5 Revenue Management Strategies to Crush Your Short-Term Rental Competition
- 5 Revenue Management Mistakes Costing STR Operators Money
- Revenue Management Cadences: Daily and Weekly Routines That Drive Results
- How to Choose the Right Revenue Manager for Your Short-Term Rental Business
Listen to the full conversation: Get Paid for Your Pad Podcast
About Jasper Ribbers: Jasper Ribbers is co-founder of Freewyld Foundry, where he oversees revenue management strategy for $190M+ in bookings across 4,000+ properties. He’s a pricing and data expert who has helped 75+ operators achieve an average of 18% performance lift above their markets. Connect with Jasper on LinkedIn.