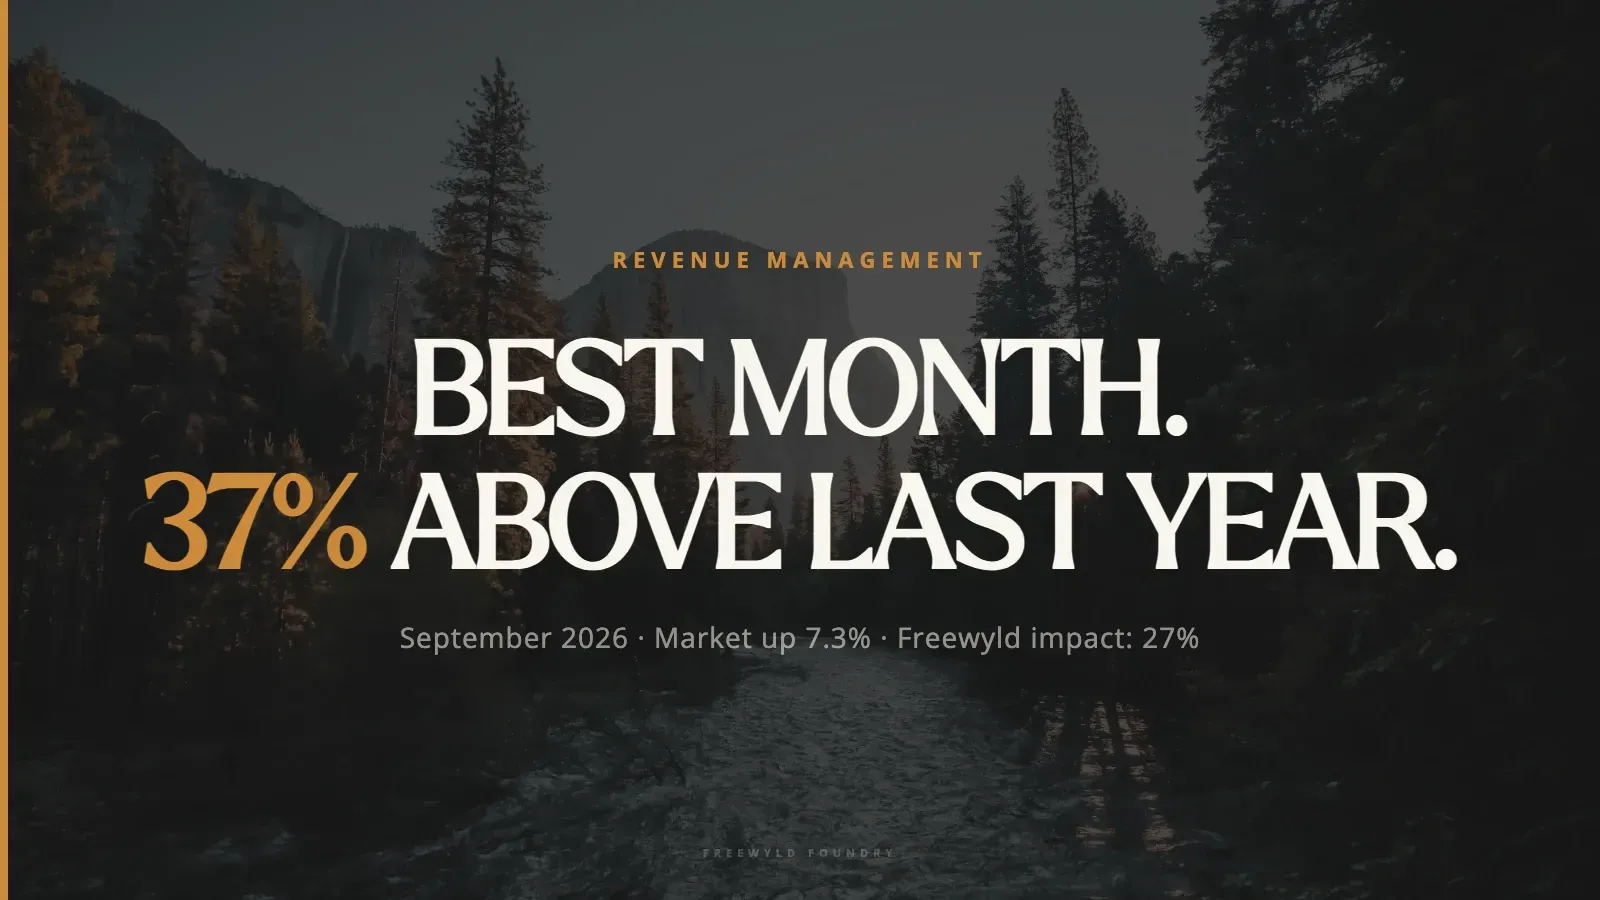
September 2026 was our best month in the history of Freewyld Foundry. That is not a phrase we use loosely. We have been running this revenue management service for about two and a half years, through high seasons and slow ones, across more than 75 markets in the US, Canada, and internationally. September 2026 outperformed every single month before it.
Comparable units, meaning properties that were active in both September 2025 and September 2026, finished up 37% year over year. The broader market, averaged across all the markets we track, was up 7.3%. The gap between 37% and 7.3% is our measurable impact: 27 percentage points. It is the highest we have ever recorded.
There were structural reasons September looked strong on a market-wide basis, and I will explain them. But the gap between what the market did and what our clients did does not come from calendar effects. That is operational. And it is widening.
Beyond the numbers, September brought a few developments worth paying attention to. Vrbo announced a commission structure change that follows the path Airbnb set. GuestyVal in Madrid produced the clearest industry consensus I have seen on AI in revenue management. And Airbnb’s presentation on visibility reinforced what operators should be doing to stay bookable heading into shoulder season.
Key Takeaways
- Freewyld client portfolios were up 37% in September on a comparable-unit basis while the broader market grew 7.3%, producing a 27% measurable impact, the highest in company history.
- September’s strong year-over-year result partly reflects a Labor Day calendar shift: the holiday fell in August 2025 and September 2026. Strip that out and the underlying market is flat to slightly down.
- Gainesville gained 24% and San Antonio gained 39% on strong college football and event demand. Kansas City is working through a post-World Cup inventory hangover. Carolinas beach markets and some Canada markets were down modestly.
- Vrbo is moving to a single percentage commission model, dropping the fixed-fee plan tier. The pattern mirrors how Airbnb restructured its fees.
- The GuestyVal consensus: AI handles deterministic logic well and struggles with judgment calls. Human-plus-AI delivers better results than AI alone. The human relationship will become more valuable as AI becomes more prevalent.
- Airbnb’s three levers for visibility are flexibility, availability, and discounts. If you are using their new promotions, make sure your channel markup accounts for stacking.
- Direct booking share is declining. OTAs are gaining market share this year, counter to the trend of prior years.
September by the Numbers
Across the roughly 75 markets where we manage portfolios, comparable-unit revenue was up 37% year over year for our clients in September. The comparable-unit method matters here: we include only listings that were active in both September 2025 and September 2026, with no significant calendar blocks or external disruptions that would skew the comparison. Portfolio growth gets stripped out. What remains is performance of the same listings in the same markets, year over year.
Last September, those listings generated just over $7.8 million in revenue. This September, they generated approximately $10.5 million. That is $2.5 million more from the same properties.
The broader market, averaged across all the markets we track, was up 7.3%. Our clients outperformed the market by about 27 percentage points. We call that our measurable impact: the revenue clients received above what they would have generated by moving with the market.
27% is the highest impact we have recorded. What makes September different from prior strong months is where it came from: in a declining market, outperforming the market still means you lost less than others. In September, the market grew. We outgrew it. That is a cleaner result.
The broader 2026 picture has been consistent all year. AirDNA’s data shows US RevPAR up only 3% compared to 2025, with almost all of that gain coming from ADR rather than occupancy. Most operators running without active revenue management are roughly flat. Our comparable-unit result of 37% growth in that environment is a genuine signal.
Managing the full booking window, not just the final two weeks before arrival, is where most of the performance gap comes from. By the time a listing appears in last-minute search results, the revenue upside is largely gone. The operators who outperform do it by managing pricing across the entire window, months ahead.
Which Markets Led and Which Struggled
| Market | September YoY | Notes |
|---|---|---|
| San Antonio, TX | +39%* | Strongest single-market result in the network (*by at least one data source) |
| Gainesville, FL | +24% | College football demand driver |
| Wisconsin (select markets) | +20%+ | Strong event and seasonal demand |
| Florida (select markets) | Strong | Post-summer demand holding well |
| Kansas City, MO | Down | Post-World Cup inventory still working through the market |
| Myrtle Beach, SC | Down | Coastal shoulder season pullback |
| Carolinas (beach markets) | Down | Summer demand drop-off |
| Canada (select markets) | -6% to -12% | Modest declines across several markets |
The September through November window is when sports cities and college football towns see the widest swings in year-over-year performance. A single home game weekend can move a market meaningfully. Gainesville and San Antonio both appear to have had unusually strong September event demand compared to a year ago.
Kansas City is the mirror image. The city hosted World Cup matches in summer 2025, which pulled a significant amount of new STR inventory into the market. That inventory is still there and still competing, which is compressing occupancy and rates. The hangover from a major event bringing new supply typically takes two to four quarters to work through.
The beach markets in the Carolinas are normal seasonal softening. High season in coastal markets ends sharply in mid to late August, and September rarely recovers it. What matters for those operators now is how aggressively they are pricing fall and early winter stays, and whether midterm rental opportunities are being actively pursued for the slow months ahead.
Why September Outperformed: The Labor Day Effect
Part of September’s strong year-over-year numbers have a structural explanation: Labor Day weekend.
In 2025, Labor Day fell at the end of August. In 2026, it fell in the first weekend of September. That single shift moved a high-demand holiday weekend from one month to the other. August 2026 looked soft partly because it was missing a Labor Day that August 2025 had. September 2026 looks strong partly because it gained a Labor Day that September 2025 did not have.
If you strip out the Labor Day effect, the market-wide September result is probably flat to slightly down. That is consistent with the 2026 baseline. The pacing data I am looking at for October suggests the same: roughly flat across most markets.
This matters for how you read your own performance. If your September was up 15% year over year, some of that is probably Labor Day. If you are using September as evidence to set your October projections, be careful not to carry forward a holiday boost that will not repeat.
The broader 2026 story has been a stable, low-growth market with occupancy flat to slightly down and ADR providing whatever upside exists. September was a strong month, but it was strong in a specific context. The underlying trajectory has not changed.
AI in Revenue Management: The GuestyVal Consensus
GuestyVal in Madrid brought together a concentrated group of STR industry voices, and AI in revenue management was the dominant topic across multiple sessions. Having attended and presented, I came away with a clear picture of where the industry consensus is landing. If you are evaluating whether STR conferences are worth the time and cost, GuestyVal is one of the few I would recommend without hesitation.
The consensus, stated plainly: AI plus human delivers better results than AI alone.
That is not a hedge or a diplomatic position. It reflects something operators and revenue managers are discovering in practice. AI performs exceptionally well at deterministic tasks: applying rules consistently across thousands of price points, flagging outliers in large datasets, processing rate comparisons faster than any human could. What AI struggles with is judgment, specifically the kind of call that involves weighing factors you cannot express cleanly as a number.
Consider what a revenue manager does. Across a portfolio of 100 properties, there are roughly 36,500 price points for the coming year that might need attention on any given day. No human can assess all of them manually. AI can. But among those 36,500 price points, some require a judgment call: a unit that has never booked above a certain rate, a weekend where comparable properties are pricing unusually, a market event that appeared in a news source rather than a booking feed.
At Freewyld Foundry, we use AI to identify the price points with the highest likelihood of needing human review rather than having AI set prices autonomously. The criteria include things like whether we are asking a price more than 20% above the highest rate the unit has ever booked for a comparable date type, or whether similar listings we manage have never transacted at that level. AI surfaces those candidates. A human decides what to do. If you want to build something similar for your own portfolio, the full breakdown of how to use AI to optimize your STR pricing is a good starting point.
The other pattern I noticed across multiple talks at GuestyVal was an expectation that the human relationship will become more valuable as AI becomes more prevalent, not less. As guests interact more and more with AI-generated responses and automated systems, operators and managers who offer genuine human expertise will stand out. The relationship is differentiating, not commoditizing.
This matches what I observe in our own business. Clients who sign up with us are not buying a pricing algorithm. They are buying judgment applied consistently at scale. The AI makes that judgment faster and more consistent. It does not replace the judgment.
Vrbo’s Commission Simplification
One of the more concrete platform developments from GuestyVal: Vrbo announced it is moving to a single percentage commission model.
Previously, Vrbo offered hosts two options. One involved paying a fixed annual subscription fee plus a low transaction percentage, typically around 5%. The other was a percentage-only model at approximately 8% with no fixed fee. The new structure consolidates those into a single percentage model, dropping the fixed-fee subscription option.
The pattern is familiar. Airbnb went through a similar restructuring of its commission model in prior years. Booking.com has always operated on a percentage basis. Vrbo, owned by Expedia, is following Airbnb’s lead in simplifying its pricing structure.
For operators currently on Vrbo’s fixed-fee plan, this change is worth calculating carefully. If your annual Vrbo booking volume was high enough that the fixed fee was cheaper than the percentage alternative, the new model likely increases your effective commission cost. For operators already on the percentage plan, the change is neutral.
This is also part of a broader pattern in how OTAs are structuring their revenue models. Every major platform is now investing in promotional discounts, paid visibility programs, and loyalty features that add layers of optional spend on top of the base commission. The commission line item is one variable. The more complex variable is how you are managing channel pricing, markup, and promotional exposure across the stack as each platform adds new tools.
Airbnb Visibility: Flexibility, Availability, Discounts
Airbnb presented at GuestyVal on how operators can improve their visibility on the platform. The three levers they emphasized have been consistent with what Airbnb has been saying to property managers, but they covered each one explicitly.
Flexibility refers to cancellation policies. Airbnb’s algorithm favors listings that offer flexible or moderate cancellation terms over strict policies. From the platform’s perspective, this reduces friction for guests at the point of booking. The tradeoff for operators is protection: a strict policy reduces your cancellation risk but reduces your placement in search results. If your market typically has low cancellation rates, loosening your policy is a lower-risk adjustment than it might appear.
Availability covers three related factors: minimizing minimum stay restrictions, keeping your calendar open at least 12 months out, and not blocking short lead times or same-day check-ins where feasible. An operator listed as bookable only 90 days out with a 3-night minimum and no same-day availability is showing Airbnb a constrained listing, and the algorithm treats it accordingly.
Discounts refers to Airbnb’s growing stack of promotional tools: early bird discounts, length-of-stay discounts, last-minute discounts, top-rated guest discounts, and mobile booking discounts. Airbnb wants operators to activate these because they drive booking conversion. The complication is that several of these discounts stack, meaning a qualifying guest can receive a meaningful combined discount off your displayed price.
If you activate these promotions without adjusting your channel markup to account for stacking, your effective rate will fall below your intended floor on some bookings. The right approach is to understand which combinations are possible, calculate the maximum combined discount exposure, and build that into your Airbnb markup before enabling the promotions.
How Airbnb discounts and promotions stack is covered in detail in a separate article if you want to go through the math.
The Direct Booking Trend Reversal
One data point from GuestyVal surprised me: direct booking share has been declining in 2026.
The expectation based on the prior few years was that professional operators would progressively shift a larger share of repeat guests to direct channels through outreach, loyalty programs, and brand-building. OTAs would still dominate discovery, but operators who ran their businesses well would capture more of their returning guests directly over time.
The data presented at GuestyVal showed the opposite happening this year. OTAs are gaining market share versus direct bookings. My read on why: OTAs have been aggressively investing in loyalty programs, promotional discounts, and mobile optimization, giving a guest already on their platform a strong reason to rebook through it rather than seeking out the operator’s direct site. The conference did not point to a single explanation, but the pattern is clear.
This does not mean direct booking strategy is wrong. It does mean the path to capturing direct share is harder right now than it has been. If direct booking is a meaningful part of your revenue strategy, the quality of your repeat guest outreach and the usability of your direct booking experience need to be compelling enough to compete with an OTA that is actively discounting to retain the same guest.
Getting your distribution strategy right across channels means understanding this dynamic, not ignoring it.
What to Focus On Now
Two areas deserve your attention heading into Q4.
Midterm rental positioning for slow-season dates. The window when snowbirds and longer-stay travelers start booking January through March stays is open right now. If you are in a market that can attract 30 to 60 day stays, your pricing for those dates needs to be competitive and your minimum night requirements need to accommodate them. A January minimum of 7 nights rules out guests looking for 30 days. A February price calibrated for peak demand rules out the guests who will book.
Review your slow-season calendar now. Look at what a 30-night stay would cost a guest at your current settings, and ask whether that price is competitive with furnished apartments and corporate rentals in your area. A 60-day booking at a modest nightly rate often beats three weeks of inconsistent weekend demand at higher rates, with lower operational overhead and no vacancy gaps in between. Midterm rental strategy for STR operators covers the data and the math in detail if you want to evaluate whether pursuing MTR makes sense for your specific market.
Platform visibility and markup audit. If you have been activating Airbnb promotions without reviewing your channel markup, run the math now. Identify which discounts are currently active, which ones can stack, and what the maximum combined discount a qualifying guest could receive would be. Then verify that your Airbnb markup, relative to your base price, protects your rate floor under that worst-case scenario.
The same logic applies to Vrbo as it introduces its new commission model and continues expanding its promotions program. How to price short-term rentals in shoulder season covers the specifics of rate-setting as demand contracts. And avoiding the most common STR revenue management mistakes usually comes down to exactly this kind of detail work. The big-picture strategy matters, but the revenue left on the table typically lives in the specifics.
Where September Leaves You
September 2026 was a strong month for short-term rental operators in most markets, boosted partly by the Labor Day calendar shift. The underlying market, outside that structural boost, is roughly flat, which matches the 2026 story: modest ADR growth, occupancy holding, no significant tailwind from demand expansion.
In that environment, the results our client portfolios produced, 27% measurable impact above market, reflect what revenue management does. It is not about catching a rising tide. It is about outperforming the conditions you are given.
The platform changes coming out of fall 2026, from Vrbo’s commission restructuring to Airbnb’s expanding discount rollout, add operational complexity. The AI discussion at GuestyVal suggests the answer to that complexity is not to automate it entirely but to use AI to surface what needs attention and apply human judgment where the data alone cannot decide.
If you want to understand how your portfolio compares, apply for a free revenue report. We manage $215M+ in bookings across 3,900+ properties and we will show you exactly where your pricing strategy has room to improve. Our clients average 18% above their market, across strong months and difficult ones.
Listen to the Full Market Update
For the complete September breakdown, including the full GuestyVal AI sessions, Jasper’s account of leaving an Airbnb early for the first time in over 100 stays, and what the guest-side Airbnb resolution process looks like in practice, listen to Get Paid for Your Pad Episode 737.
Listen on Acast | Watch on YouTube
Related Articles
- STR Market Update August 2026: 16.3% Growth While the Market Fell 2.5% - The month-before context, including the OTA discount stacking breakdown and the VRBO sponsored listings launch.
- STR Market Update July 2026: Freewyld at 29.8%, the Airbnb Discount Decision - The World Cup market analysis and the Airbnb top-rated guest discount mechanics.
- STR Market Update June 2026: World Cup Impact, Top Markets, and Airbnb’s New Discounts - The June results and the first look at Airbnb’s promotional discount rollout.
- The Complete Guide to Airbnb Discounts and Promotions - How Airbnb’s discount system works, how discounts stack, and how to set your channel markup correctly.
- STR Distribution Channels: Which Platforms Should You Be On - A full breakdown of Airbnb, VRBO, Booking.com, and direct bookings, including platform-specific strategy.
- Midterm Rentals for STR Operators: The Data, the Math, and How to Decide - Whether MTR makes sense for your market and how to price and position for longer stays.
- How to Use AI to Optimize Your STR Pricing - A step-by-step breakdown of how to build AI into your revenue management process without giving up human judgment.