
Most short-term rental pricing advice assumes your property competes for the same guest as every other listing in your market. Someone decides to visit Nashville, opens Airbnb, filters by dates and price, and picks from whatever comes up. Your job is to price competitively within that demand pool.
PriceLabs Portfolio Occupancy-Based Adjustment is a per-day calculation strategy that works for unique STR inventory with near-100% occupancy year-round. Unlike standard market-based pricing, this approach uses your property’s actual booking patterns to drive pricing decisions when destination demand exceeds normal market signals.
That model works for a lot of inventory. It does not work for all of it.
Some properties attract guests who found the property first and then decided to travel because of it. Glamping domes with a waiting list. Tree houses that go viral on Instagram. Unique cabins people drive five hours to specifically because of how they look. For this type of destination inventory, the market seasonality and demand signals that PriceLabs uses as its foundation are not your seasonality and demand signals. They are someone else’s, and applying them to your pricing actively works against you.
This is a problem we ran into recently with a glamping dome portfolio. What our team figured out changed how I think about pricing for unique inventory. Here is what we did, what happened, and how to know whether a similar approach makes sense for your properties.
Key Takeaways
- PriceLabs Portfolio Occupancy-Based Adjustment calculates occupancy on a per-day basis, not a date-range basis, giving you precise control over pricing for each specific calendar date
- When your property runs near 100% occupancy year-round, turning off seasonality and demand factors simplifies your setup and gives you full control through the matrix
- Destination inventory with very long booking windows (200-plus days) needs date range columns in the matrix that extend well beyond what standard STR properties require
- Different unit types within the same portfolio often need separate matrices, especially when their booking patterns differ significantly
- Sundays frequently need their own day-of-week adjustment because they behave differently from both weekdays and weekend peak nights
- Keep the setup as simple as possible: the more levers you add, the harder it becomes to understand what is driving your prices and what to adjust when results drift
What “Unique Inventory” Means for Pricing
The standard PriceLabs setup works on the assumption that your property competes for the same guest as comparable listings in your market. PriceLabs pulls seasonality data from the broader market and applies it to your prices. It adjusts for demand fluctuations based on what is happening across comparable listings. That is the right approach for standard inventory.
Destination inventory breaks that assumption. A guest who books a glamping dome with a waiting list did not open Airbnb, type in a city, and then pick your property from a list of options. They found your property specifically, decided they wanted to stay there, and then planned the trip around it. The market’s demand curve is irrelevant to their booking behavior.
The clearest signal that your property falls into this category is occupancy. If you are running at 95% or above year-round, you are not following market demand. Normal markets have seasonality, soft months, low-demand weeks. If your property is full in January the same way it is full in July, something specific to your inventory is driving that demand, and market data will not help you price it.
The second signal is booking window. Standard STRs in most markets see bookings come in 30 to 90 days in advance for peak periods. If your guests are booking six months out, you are operating in a different market than the PriceLabs data is designed for. Booking window is one of the most underused pricing signals in the entire revenue management toolkit, and for unique inventory, it becomes the primary input for your matrix structure.
The Portfolio We Worked With
One of our revenue managers, Javier Vasquez, took on a portfolio of glamping domes near Toronto, Canada. Two unit types: three Forest Domes, listed as the premium category, and five middle units. Combined occupancy was running at 97 to 98% year-round with a waiting list. The Forest Domes were booking 212 days in advance for peak months. The middle units were booking roughly 140 days out.
When Javier looked at the historical data, the standard pricing levers were creating noise, not signal. The seasonality factor in PriceLabs was adding and subtracting from the base price based on what the broader market was doing, which had almost no relationship to how these specific units were booking. The demand factor was doing the same thing. The result was pricing that was harder to understand and harder to improve, because you could not isolate what was driving outcomes.
The decision: turn off seasonality and demand factors entirely, and run everything through a custom PriceLabs Portfolio Occupancy-Based Adjustment matrix. This was the first time our team had done a setup without those two core factors. It required treating the property’s own historical booking data as the only meaningful signal.
Portfolio Occupancy-Based Adjustment vs Standard Occupancy Adjustment
PriceLabs has two types of occupancy-based adjustments, and the difference matters a lot.
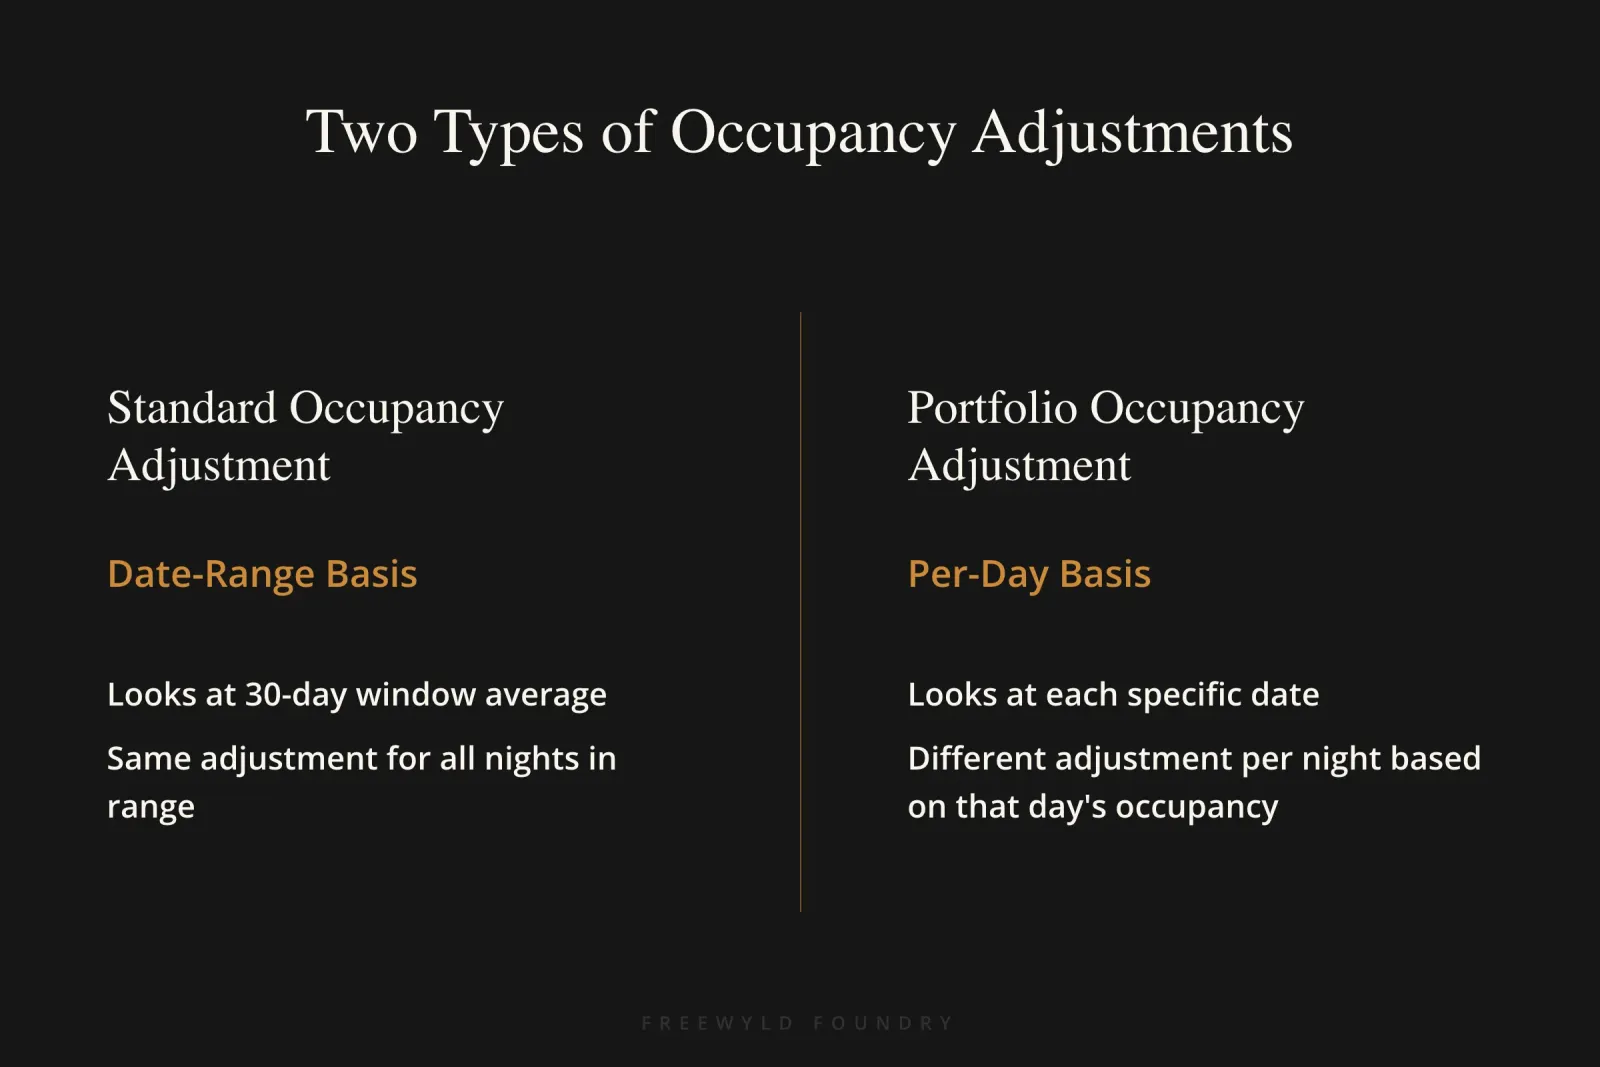
The standard occupancy-based adjustment works on a date-range basis. You set rules like: if my listing is less than 30% occupied over the next 30 days, apply a 10% discount. That range-based logic is useful for standard properties, but it is a blunt instrument. It treats all nights in that 30-day window the same, even if some dates have three of your five units booked and others have zero.
Portfolio Occupancy-Based Adjustment works on a per-day basis. For each specific calendar date, it looks at how many of your units are booked and applies adjustments based on that exact day’s occupancy. If November 14 has four of five units booked, the price for November 14 reflects an 80% occupancy rate on that specific night, not an average across the next 30 days. November 15 might have one unit booked, pricing at 20% occupancy, regardless of what the surrounding dates look like.
For destination inventory with high baseline demand, this per-day calculation is the only approach that gives you the precision to yield revenue appropriately. A date that is nearly sold out should price at a premium. A date with availability in the last two weeks should discount. Doing this right requires per-day calculation, not a range.
To access Portfolio Occupancy-Based Adjustment in PriceLabs: enable it through the control panel, then create a group. It does not appear in the standard listing customization view. The group is required for the feature to show up, even for multi-unit listings.
Building the Matrix
The matrix is where the strategy comes to life. For the dome portfolio, Javier built separate matrices for the Forest Domes and the middle units, because their booking windows and occupancy patterns are different enough that a shared matrix would compromise both.
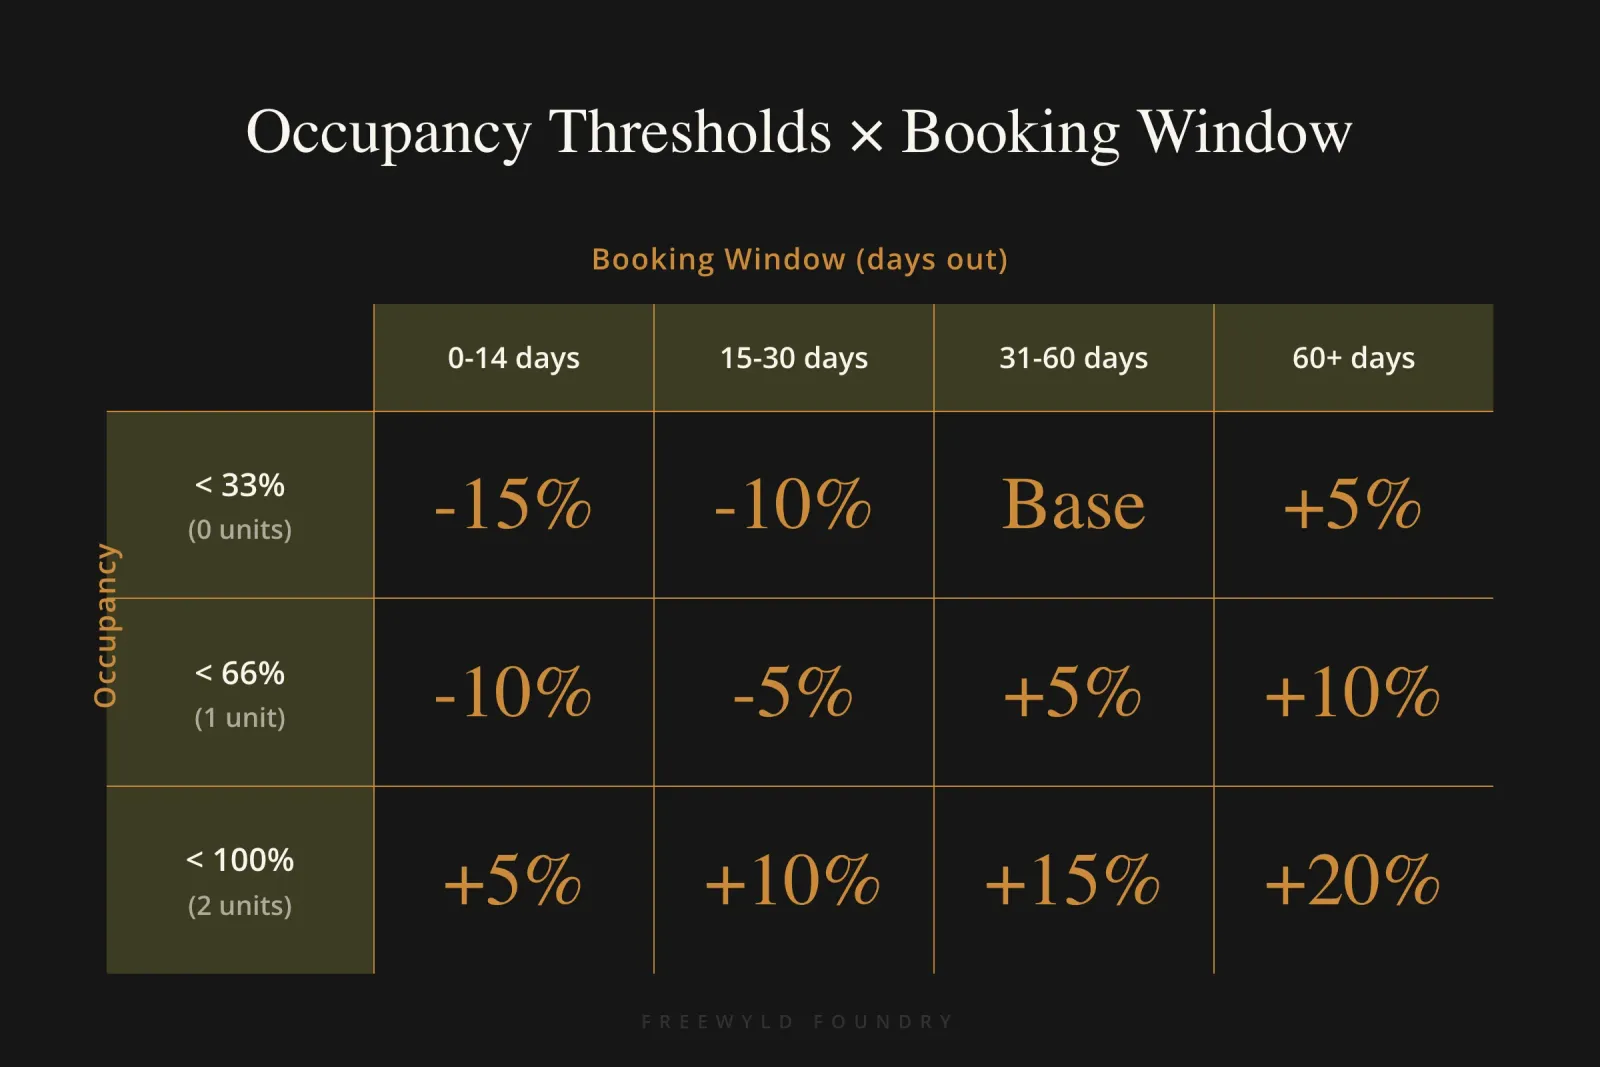
Each matrix has two dimensions: occupancy thresholds (how many units are booked on a given date) and booking window columns (how far in advance the pricing applies).
Occupancy thresholds for the Forest Domes, with three units, look like this: less than 33% (zero units booked), less than 66% (one unit booked), less than 100% (two units booked). When all three are booked, the date is sold out and pricing is irrelevant. The matrix applies the right row based on what is booked on that specific day.
Booking window columns for the Forest Domes reflect the 212-day average window for peak months. The matrix includes columns for 0 to 14 days, 15 to 30 days, 31 to 60 days, and so on, extending to cover the full booking window. At 0 to 14 days with no units booked, the matrix applies a 15% discount to the base price. With two out of three units booked in the last two weeks, it applies a 5% premium, because these units have enough demand to fill even at the last minute. The matrix adjusts the last-minute discount and premium thresholds separately based on which occupancy tier applies.
Javier added a 366-plus-day column after bookings for October 2027 started arriving. The original matrix only extended through the current 12-month window, so ultra-early bookings landed outside the matrix and were not capturing any premium. If your inventory books far in advance, protect that window in your setup.
The Sunday Problem
One of the more nuanced findings from this setup: Sundays need their own treatment.
Standard weekend pricing logic groups Friday, Saturday, and Sunday together as “weekend” and applies a day-of-week premium across all three. For these domes, that was wrong. Sundays were booking at prices below peak weekend rates but above weekday rates. Lumping them into the weekend category was overstating Sunday prices. Including them in weekday logic was understating them.
The fix was a day-of-week adjustment applied only on Sundays, keeping the matrix premium logic for Friday and Saturday and creating a middle-tier price signal for Sunday. This is the kind of adjustment that only shows up when you are watching the data closely, which is exactly why monitoring after implementation matters as much as the initial setup.
“In revenue management, we always want to keep our setup as simple as possible. The more settings you apply, the harder it is to understand what’s happening with the pricing. And then it’s also harder to learn and harder to improve.”
The principle behind that quote is worth holding onto. Every additional lever you add creates complexity that makes it harder to know what is driving your results. The Sunday adjustment was worth adding because it reflected a real and consistent pattern in the data. Adding complexity just because you can is a different thing entirely.
Last-Minute Discounts: Built Into the Matrix
One of the cleaner aspects of this setup: no separate last-minute discount setting is needed.
In a standard PriceLabs configuration, you set last-minute discounts as a separate customization layer, often a percentage discount applied within a certain number of days of check-in. That works fine alongside normal seasonality and demand factors. When you have removed those factors and replaced them with a matrix, the matrix itself handles last-minute pricing through the 0 to 14 day column.
For dates approaching check-in with available inventory, the matrix applies the appropriate discount in the 0 to 14 day booking window column. Adding a separate last-minute discount setting on top of that would stack the two adjustments. Keep the discounting logic in one place, inside the matrix, and the whole system stays coherent.
This is a good example of what simplicity looks like in practice. It is not fewer adjustments for the sake of fewer adjustments. It is eliminating redundancy so you always know which setting is doing which job. Complexity in pricing setups is one of the most common ways operators lose control.
The Javier Effect: Results From the First Two Months
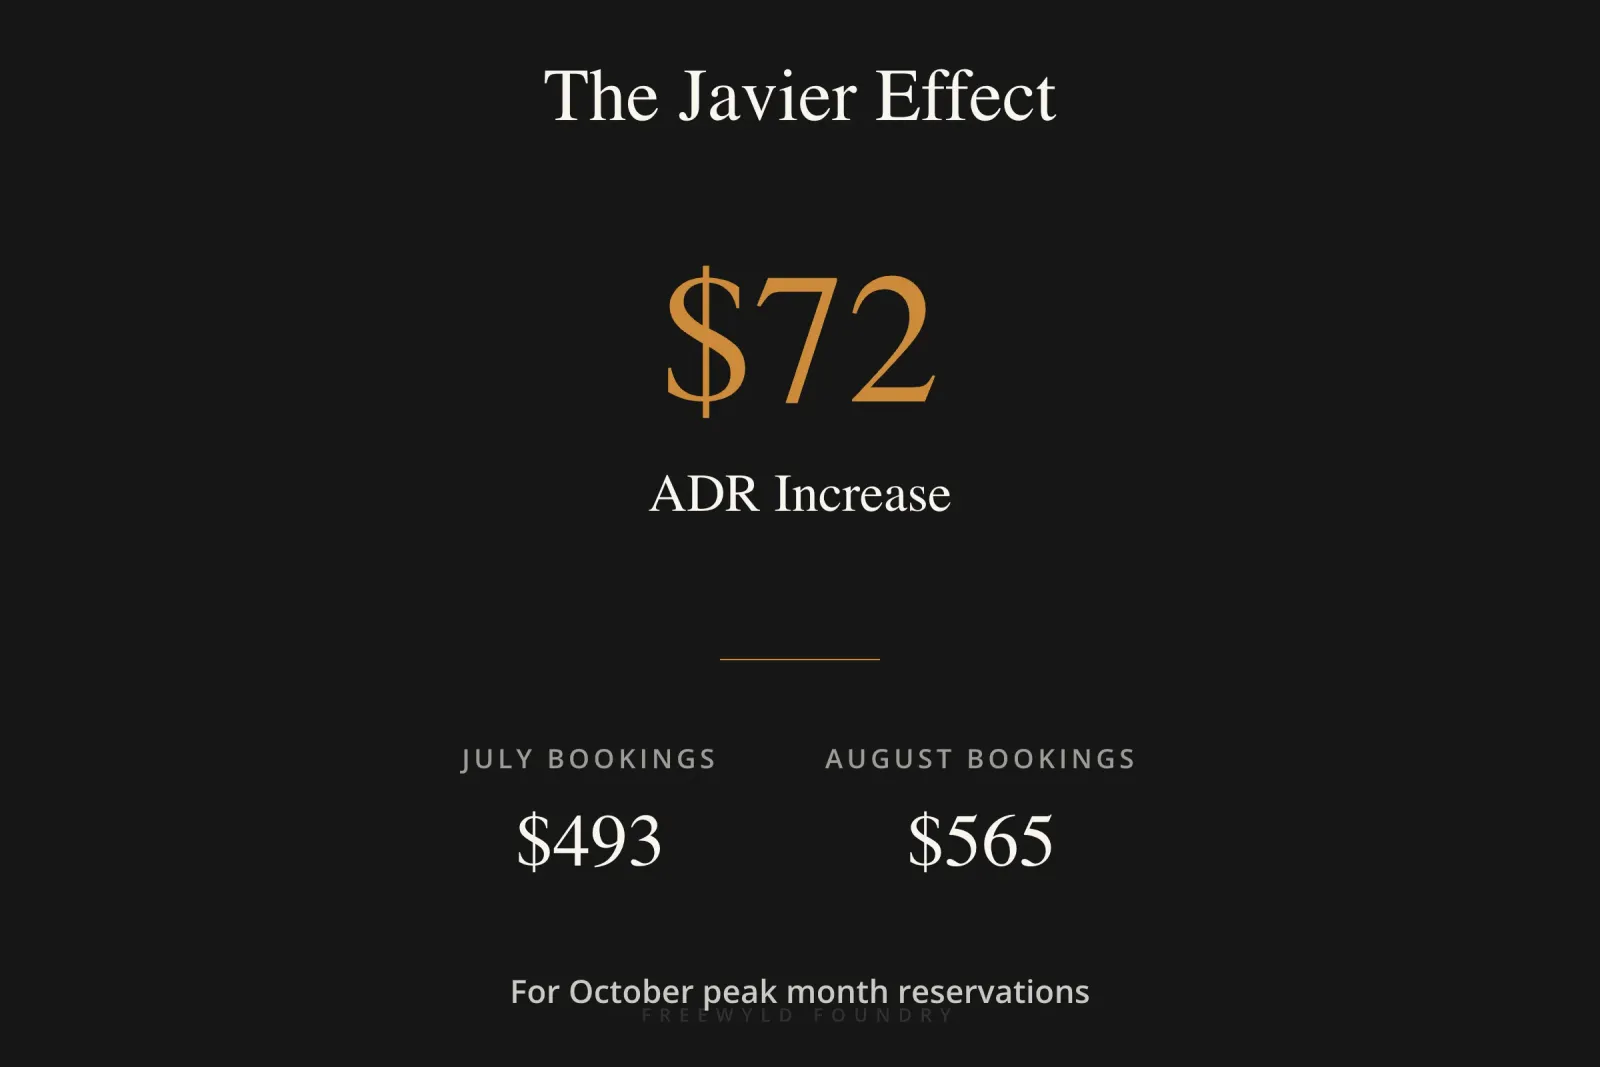
Javier implemented this strategy in mid-July. When we look at booking date data for October, the peak month for this portfolio, the ADR on bookings made in July averaged $493 Canadian. Bookings made in August, after the strategy was in place, averaged $565. That is a $72 increase in ADR on bookings coming in for the same dates.
There is an important caveat in this number: when the team took over the portfolio, most weekend dates in peak months were already booked under the previous flat pricing. The measurable gains so far are almost entirely from weekday inventory, because that is what was available when the new strategy took effect. The weekend ADR difference on the few available weekend dates is closer to $250 Canadian above prior rates, but the sample size is small.
For November and December, which are outside peak season, the team will have had full control of the booking window from the start. That is where you will see the real measure of the strategy, unfiltered by inherited reservations. The early pacing signals are positive: the portfolio is tracking ahead of last year in both ADR and occupancy heading into those months.
How to Know If This Approach Is Right for Your Inventory
This is not a strategy for most STR properties. Here is how to think about whether it applies to yours.
Occupancy is the primary tell. If your property is consistently above 95% year-round, you are not following normal market demand. Applying market factors to a property that the market does not govern is adding noise to your pricing setup. The cleaner move is to remove those factors and build pricing directly from your property’s own patterns.
Booking window is the secondary signal. Standard STR booking windows in most markets are 30 to 90 days for peak periods. If your guests are booking 150, 200, or 250 days in advance, the date-range logic built into standard occupancy adjustments was not designed for your situation. You need a matrix with columns that reflect your booking timeline.
Comparable inventory matters. If there are dozens of properties similar to yours in the market, the PriceLabs market data is probably relevant. If your property is one of a kind, without comparable inventory for PriceLabs to pull market signals from, those signals are going to be based on inventory that does not compete for the same guest.
For standard inventory, none of this applies. Use seasonality, use demand factor, and tune PriceLabs the conventional way. The goal in every case is to understand what is driving your bookings and price according to that, not according to a model built for a different type of property.
Step-by-Step: Setting Up Portfolio Occupancy-Based Adjustment
If you have identified that your inventory fits the criteria above, here is how to approach the setup.
Step 1: Pull your historical booking data. Before touching any settings, analyze when your bookings come in relative to check-in. What is your average booking window for peak months? For low months? Do weekdays and weekends show materially different patterns? This is the data your matrix will be built from.
Step 2: Enable Portfolio Occupancy-Based Adjustment in PriceLabs. Go to the control panel and enable the feature. Then create a group that includes the listings you want to price together. The feature will not appear in your listing customizations without a group set up.
Step 3: Decide whether to turn off seasonality and demand factors. This is the step most operators will not need to take. Only disable these if your occupancy is near 100% year-round and your booking patterns are disconnected from market demand. If you are on the fence, leave them on and add the matrix as an additional layer first, then evaluate.
Step 4: Define your occupancy thresholds. For a 5-unit portfolio, your thresholds might be 0%, 20%, 40%, 60%, 80%. For a 3-unit portfolio like the Forest Domes, they are 33%, 66%, 100%. The thresholds should match how your inventory divides.
Step 5: Define your booking window columns. Use your actual booking data from Step 1. If 80% of your bookings come in within 90 days, your columns might be 0 to 14 days, 15 to 30 days, 31 to 60 days, 61 to 90 days, and 91-plus. If you book 200 days out, extend the columns accordingly, and add a 366-plus column if you see any ultra-early bookings.
Step 6: Set adjustments for each cell. Start conservative. It is easier to tighten premiums than to explain why a guest who booked at the last minute paid significantly less than someone who booked three months earlier. Use your historical ADR data by occupancy level and booking window as the baseline.
Step 7: Monitor and iterate. This is where most of the value is captured in revenue management. Set a two-week review cadence for the first three months. Watch how occupancy builds on future dates relative to historical patterns. If bookings are coming in faster than expected, the matrix may be underpricing. If they are coming in slower, you may be overpricing relative to your guests’ price sensitivity at that booking window.
The Bigger Principle
What makes this strategy work is not the specific settings. It is the discipline of pricing based on what is true about your property, not what is true about the average property in your market.
Most operators default to whatever their pricing tool recommends because the defaults feel safe. For standard inventory, that is a reasonable starting point. For destination or unique inventory, the default recommendations may be based entirely on comparable data that has nothing to do with your guests’ booking behavior.
Understanding your own data, where your guests are coming from, when they book, how they respond to price changes at different points in the booking window, is the foundation of any pricing strategy that is going to outperform over time. The matrix is just the tool for implementing what the data tells you.
If you want to understand where your portfolio has room to improve, whether on pricing, distribution, or setup, apply for a free revenue report. We manage $170M-plus in bookings across 3,500-plus listings and will show you exactly what the data says about your specific properties.
Frequently Asked Questions About PriceLabs Portfolio Occupancy-Based Adjustment
What is PriceLabs Portfolio Occupancy-Based Adjustment?
PriceLabs Portfolio Occupancy-Based Adjustment is a per-day pricing calculation that adjusts rates based on how many units are booked on each specific calendar date, rather than using date-range averages. It gives you precise control over pricing for high-demand inventory that doesn’t follow normal market patterns.
When should I use Portfolio Occupancy-Based Adjustment instead of standard PriceLabs settings?
Use Portfolio Occupancy-Based Adjustment when your property runs at 95%-plus occupancy year-round, has booking windows exceeding 150 days, or attracts destination demand that isn’t tied to broader market seasonality. Standard PriceLabs settings work better for inventory competing within normal market demand pools.
How is Portfolio Occupancy-Based Adjustment different from standard occupancy-based pricing?
Standard occupancy-based pricing uses date-range calculations (like “30% occupied over the next 30 days”). Portfolio Occupancy-Based Adjustment calculates occupancy for each specific date independently, so November 14 prices based on November 14’s occupancy, not an average across surrounding dates.
Can I use PriceLabs Portfolio Occupancy-Based Adjustment with seasonality and demand factors enabled?
Yes, but for high-occupancy destination inventory, those market factors often add noise rather than signal. Most operators using Portfolio Occupancy-Based Adjustment for unique inventory turn off seasonality and demand factors to maintain full control through the matrix.
How far out should my booking window columns extend in the matrix?
Extend your booking window columns to match your actual booking patterns. Standard STR properties might stop at 90 days, but destination inventory booking 200-plus days in advance needs columns extending through 366-plus days to capture ultra-early bookings.
Do I need separate matrices for different unit types in the same portfolio?
Yes, if their booking patterns differ significantly. In the glamping dome case study, Forest Domes booked 212 days out while middle units booked 140 days out, requiring separate matrices to optimize pricing for each unit type.
How often should I adjust my PriceLabs Portfolio Occupancy-Based Adjustment matrix?
Set a two-week review cadence for the first three months after implementation. After that, monthly reviews are typically sufficient unless you notice booking patterns shifting significantly faster or slower than historical norms.
What happens to last-minute discounts when using Portfolio Occupancy-Based Adjustment?
Last-minute discounts are built into the matrix through the 0 to 14 day booking window column. You should not use a separate last-minute discount setting on top of the matrix, as this would stack adjustments and create pricing confusion.
Listen to the Full Conversation
This article was informed by a conversation with Javier Vasquez, revenue manager at Freewyld Foundry and former PriceLabs team member, on the Get Paid for Your Pad podcast.
Listen on Acast | Watch on YouTube
Related Articles
- Booking Window Strategy: When to Raise and Lower Your Airbnb Prices - The full breakdown of how booking window should drive pricing decisions, and how to read your own window data.
- PriceLabs Setup Guide: 7 Hidden Features Most STR Operators Miss - If you are starting to explore the deeper settings in PriceLabs, this covers the features most operators never touch.
- The Last-Minute Pricing Trap: Why 80% Occupancy Doesn’t Mean High Revenue - How last-minute discount logic works and why it often costs more than it saves.
- STR Revenue Management: How to Stop Leaving $20K on the Table - The broader framework for revenue management across a standard STR portfolio.