The World Cup is here.
The demand isn’t.
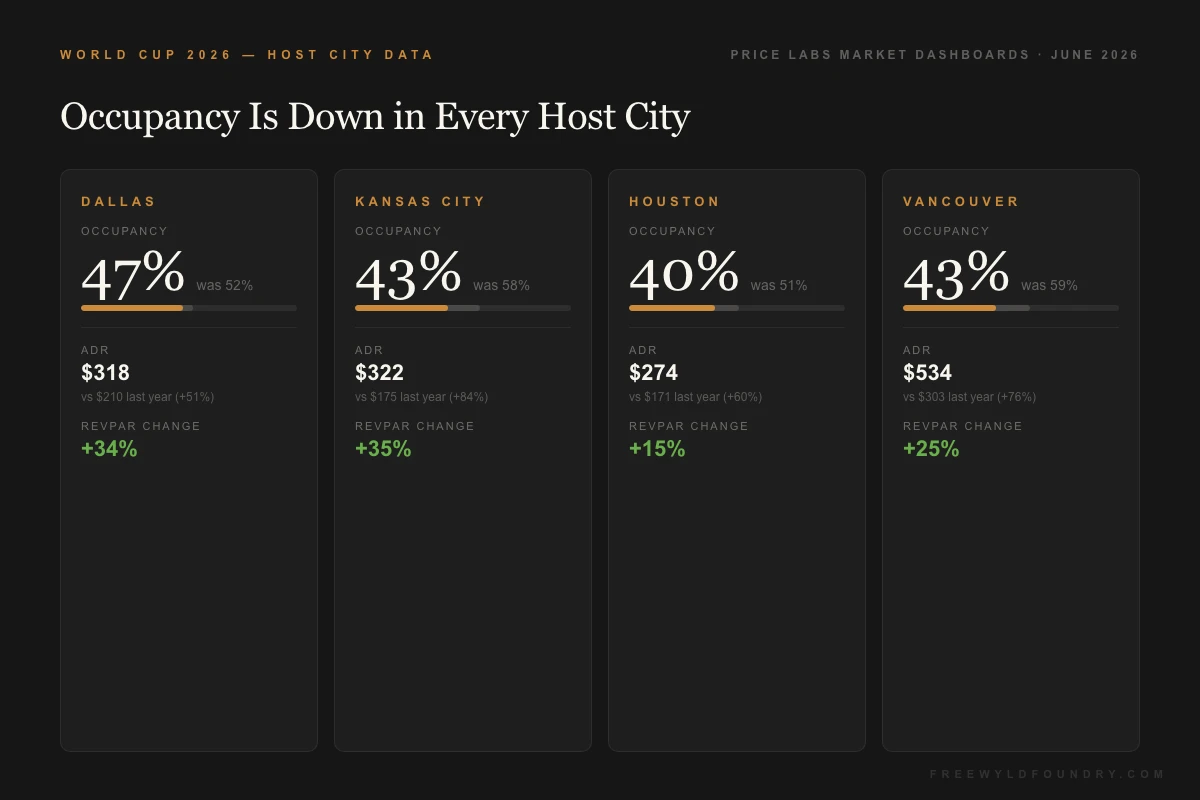
The picture across every host city is the same: occupancy is down compared to last year. Not by a little. We’re talking 10 to 15 percentage points in most markets. In Kansas City, the city with arguably the most World Cup energy of any host market, occupancy is tracking 25% below the same time last year.
How does that happen? The biggest sporting event in the world lands in your city and you end up with fewer bookings than a normal summer?
We manage revenue for about 75 markets around the world, mostly in the US, so we have a direct view of what’s actually happening versus what everyone predicted. Here’s the real data, the two reasons behind it, and a practical pricing strategy for the rest of the tournament.
There’s still opportunity here. But you need to understand what you’re actually working with.
Key Takeaways
- Occupancy is down in every World Cup host city compared to last year, by 10 to 16 percentage points depending on the market
- ADR is significantly up (50% to 85% in most cities), which means RevPAR is still higher than last year, but performance is very polarized
- Properties that got booked are doing well. Properties holding peak pricing are sitting empty
- Two reasons for the demand gap: elevated prices driving away regular travelers, and international demand well below expectations
- The US market overall is flat for June, but up 14% for July
- Group stage strategy: be competitive, not cheap, but be at the lower end of market range
- Knockout stage strategy: hold or increase rates once bracket matchups are set, especially if major footballing nations are playing in your city
Why the Demand Disappeared
Two forces are behind these numbers. Understanding them is what explains the right strategy going forward.
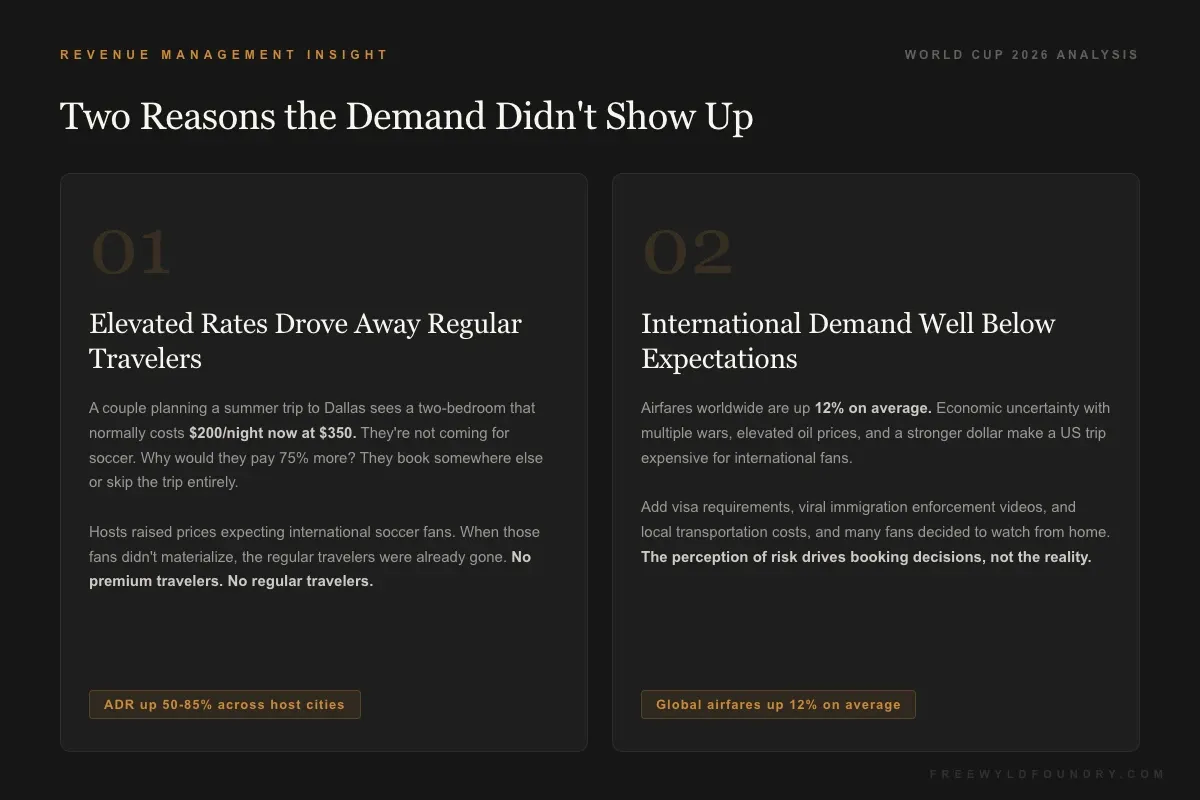
Regular Travelers Are Avoiding Host Cities
Here’s the dynamic that most people missed when setting their pricing: your elevated rates aren’t just failing to attract World Cup travelers, they’re driving away the people who would normally be booking your property anyway.
Think about a couple planning a summer trip to Dallas. They check Airbnb and see that a two-bedroom that normally costs $200 a night is now showing at $350. They’re not coming for soccer. Why would they pay 75% more? They book somewhere else, or they go somewhere else entirely.
This is the last minute pricing trap in its worst form, except it plays out over weeks instead of days. Hosts raised prices expecting international soccer fans to fill those rooms. When the soccer fans didn’t materialize at the expected volume, the regular travelers were already gone. You’re left with the worst of both worlds: no premium travelers, no regular travelers.
International Demand Fell Short
The international demand story is more complicated, and honestly, it involves factors outside anyone’s control.
Airfares are up 12% on average worldwide right now. Oil prices are elevated. With multiple wars ongoing and broader economic uncertainty, discretionary spending on international travel has taken a hit. A trip to the US for the World Cup, once you factor in flights, accommodation, tickets, local transportation, and day-to-day costs, is an expensive proposition for most international fans.
Local transportation costs in host cities made this worse. The jump in train ticket prices to stadiums was well-documented, but it’s part of a broader pattern where every service connected to World Cup dates increased dramatically in price. For families or groups traveling from South America or Europe, the total cost calculation became very unfavorable.
Then there’s the immigration perception issue. There are videos circulating internationally of US immigration enforcement operations. Most international travelers who actually go through US immigration have no problems, which is what journalists covering the tournament are reporting from the ground. But perception drives booking decisions, and the perception in many countries is that traveling to the US right now involves risk. That’s keeping a meaningful portion of international fans home.
The Numbers: City by City
These figures come directly from Price Labs market dashboards. Real occupancy numbers for June 2026 compared to June 2025.
| City | Occupancy Now | Last Year | ADR Now | ADR Last Year | RevPAR Change |
|---|---|---|---|---|---|
| Dallas | 47% | 52% | $318 | $210 | +34% |
| Kansas City | 43% | 58% | $322 | $175 | +35% |
| Houston | 40% | 51% | $274 | $171 | +15% |
| Vancouver | 43% | 59% | $534 | $303 | +25% |
A few things worth noting in this data.
RevPAR is up across every market. That’s the good news. Hosts who got bookings are doing well because the rates they booked at are meaningfully higher than last year. If you filled your calendar at $318 a night in Dallas when you’d normally get $210, you’re having a great month.
But the occupancy story tells you why the averages are misleading. We’re at 43% in Kansas City. That means more than half the available nights in that market are unsold right now.
“It’s going to be very polarized. The people that did get bookings are doing pretty well. But there’s a lot of people that didn’t get any bookings because they were priced too high.” — Jasper Ribbers, Freewyld Foundry
This is also why market pacing data matters so much. If you’d been watching how the market was filling relative to last year starting back in March and April, the signals were there early. Our May update warned that demand was weakening significantly. The hosts who adjusted then captured bookings at solid premiums. The ones holding out for peak pricing are still waiting.
The RevPAR Paradox
Here’s the thing that makes World Cup pricing complicated: RevPAR being up is real and meaningful, but it masks what’s actually happening at the property level.
Imagine a 10-property portfolio in Kansas City. Five of those properties are booked solid through June at $322 a night, generating fantastic revenue. The other five are sitting empty because their owners held pricing at $450 or $500, waiting for soccer fans who never came. The aggregate RevPAR for the market looks healthy at +35%. But half those owners are having their worst June in years.
This is the revenue management mistake that plays out over and over during major events. People anchor on the upside scenario and miss the window entirely. By the time they’re willing to price competitively, the market has moved on. The demand that was available got absorbed by the hosts who adjusted earlier.
Understanding how dynamic pricing tools actually work matters here too. If you’re relying on your pricing tool to chase market rates automatically without any human judgment, you may have been following the market up when you should have been leading it down.
The US Market Picture
Looking beyond the host cities, the national picture for June is essentially flat. We’re seeing average RevPAR up by a couple of percent across our 75 markets, but that modest gain is driven entirely by the World Cup cities. Many non-host markets are actually down for June.
My read on this: the World Cup pricing escalation in host cities has pushed some travelers to avoid the region entirely and either not travel at all or shift trips to later in the summer. That would explain why June is soft nationally while July is shaping up differently.
July, by contrast, is looking strong. We’re up about 14% on average across our markets for July. The World Cup cities are also tracking up 20 to 30% in RevPAR for July. I think a meaningful portion of people who skipped June travel are planning July trips instead. And some of the international World Cup visitors who do come will likely extend their stay, traveling around the US to see major attractions after the games.
If you have properties outside the host cities, this is actually good news for your summer. And if you’re in a host city, the July picture is more encouraging than June.
The Strategy for What’s Left
The tournament runs through July 19. There’s still meaningful revenue to capture.
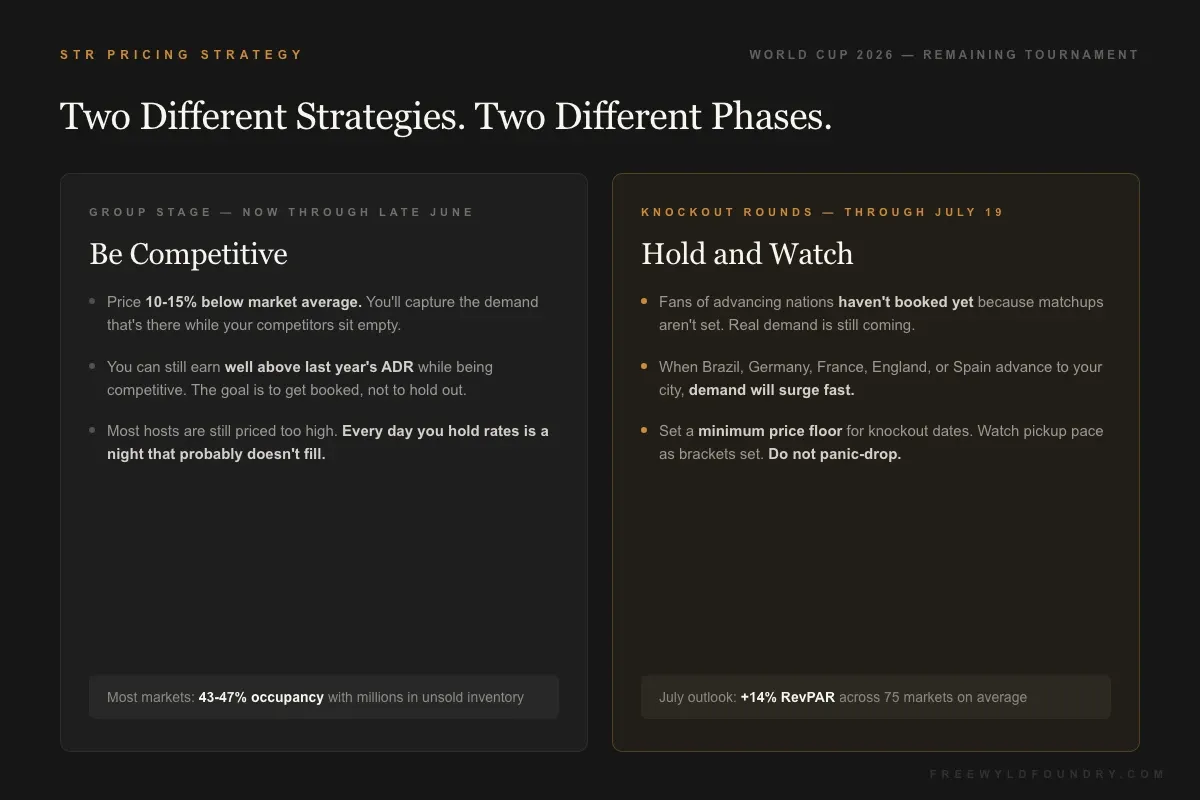
Group Stage: Be Competitive
The group stage runs through late June. For these dates, your job is to stop holding out and start competing. That doesn’t mean pricing at normal rates. You can still get meaningfully above last year’s ADR. But you need to be at the lower end of the current market range, not the upper end.
Most of your competitors still have their prices set too high. That’s actually an opportunity: price 10 to 15% below the market average and you’ll be the one capturing the demand that is there. Right now, there’s real money in peak demand pricing that actually gets bookings, not premium pricing that keeps you empty.
Don’t wait. The group stage is almost over by the time you read this. Every day you hold pricing too high is a night that’s probably not going to fill.
Knockout Rounds: Hold and Watch
The knockout stage is a different story. Here’s the key: most fans traveling for knockout stage games haven’t booked yet. They can’t, because they don’t know which games will feature their national team. My country, the Netherlands, might be playing in Dallas. Or Houston. Or we might be out of the tournament entirely. That’s unknowable right now.
As the bracket sets, fans of major footballing nations will start booking travel quickly. Brazil, Germany, France, England, Spain, Argentina - these are countries with massive passionate fan bases and the financial capacity to make last-minute international trips happen. If any of these teams is playing a quarterfinal or semifinal in your city, demand will surge.
The finals are July 13 (third place) and July 19. If you have availability near a venue that’s hosting late-stage games, hold pricing at a meaningful premium for those specific dates. Don’t panic-drop. The demand hasn’t arrived yet because it’s waiting for the matchups to be known.
Think about it this way: if someone told you your team was playing in the World Cup final, and you could be in the stadium to watch them potentially win - would you let price stop you? For a lot of fans, the answer is no. That’s the demand you’re pricing for in the knockout rounds.
Using Price Labs for the Rest of the Tournament
If you’re using Price Labs features to manage this, a few specific moves make sense right now:
Pull up your market dashboard and compare current occupancy pacing to last year for the remaining tournament dates. If you’re meaningfully behind, your pricing is too high for the group stage games. For the specific dates of knockout round games in your city, set a minimum price floor and let the market discovery work as matchups are announced.
Watch the pickup pace. Booking windows for major events can compress significantly in the knockout stage - fans booking 2 to 5 days out once they know their team advanced. A last-minute rate drop would be the wrong move precisely when real demand is finally materializing.
What This Means for Your Full Year
Before you write off the World Cup entirely, step back and look at the full picture.
RevPAR is still up in every host city. Hosts who got bookings captured real revenue at rates 50% to 85% above last year. July is tracking well nationally. And international visitors who do travel to the US for the tournament are likely to stay longer and visit more cities, which creates downstream demand for markets well beyond the host cities.
The World Cup didn’t deliver the windfall that $1,718/night headlines promised back in January. But that was always an outlier story - one market, one weekend, under ideal conditions. The real World Cup story is messier and more nuanced: strong RevPAR gains for hosts who priced intelligently, empty calendars for hosts who didn’t, and a July that’s shaping up to be genuinely good for the whole country.
The hosts who come out of this best aren’t the ones who set the highest prices in February. They’re the ones who kept adjusting, kept watching the data, and kept their properties competitive while the market figured itself out.
That’s what professional revenue management actually looks like. Not a one-time pricing decision. A continuous process of reading the market and responding to what the data says.
Want a free revenue analysis for your properties?
We manage over $190M in annual STR bookings across 4,000+ listings. Get your free revenue report and we’ll show you exactly where your pricing strategy is working and where you’re leaving money on the table.
Listen to the Full Conversation
This article was informed by the June 15, 2026 episode of the Get Paid for Your Pad podcast.
Related Articles
- World Cup 2026 STR Pricing: Why Hotels Are Calling It a Non-Event - The May 2026 pre-tournament analysis that called the demand gap early
- Peak Demand Pricing for STRs: How to Stop Leaving $10K+ on the Table - The framework for pricing major events correctly
- Stop Chasing Occupancy: 3 STR Revenue Management Mistakes Costing You Money - The pricing errors that leave hosts empty during exactly these situations
- Why STR Hosts Drop Prices Last Minute (Market Pacing Guide) - How to read booking pace before it’s too late to act