Introduction
What if you could increase your short-term rental revenue by 22% in a single month while your market only grew 4.5%? That’s exactly what happened across 4,000+ rental properties in May 2026 when we combined AI-powered pricing tools with strategic use of Airbnb’s new seasonal cancellation policies.
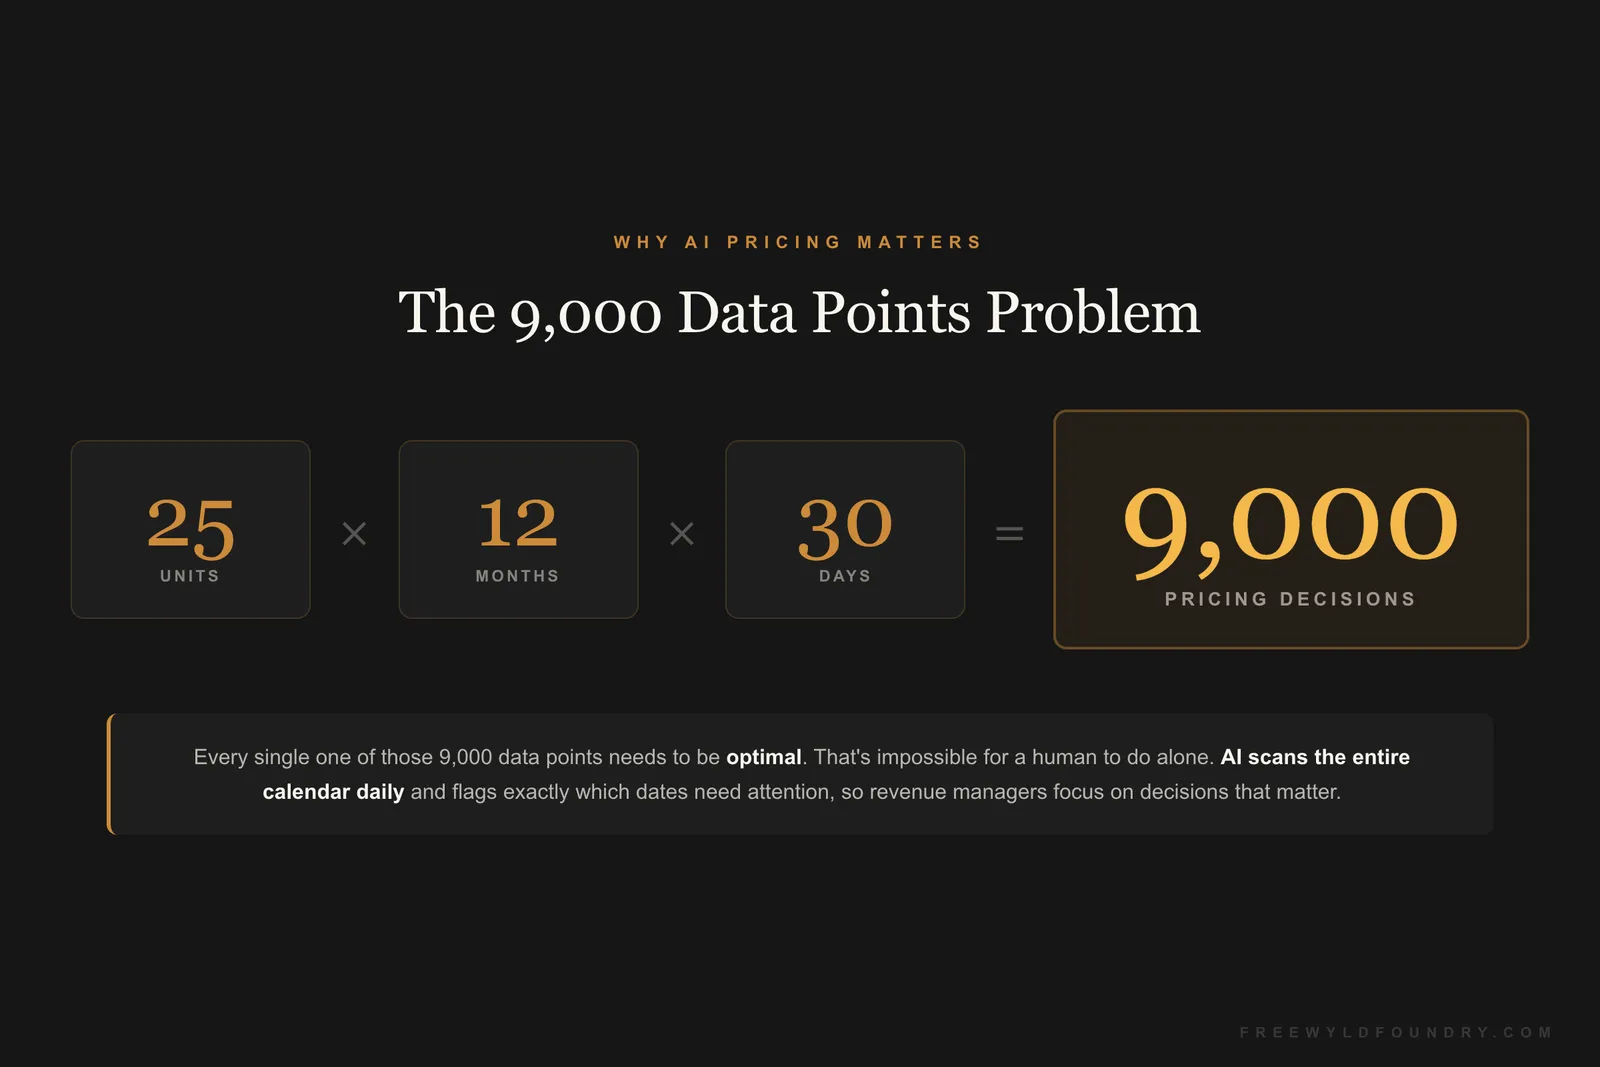
Manual pricing strategies that worked when you had 5 properties become impossible to manage at scale. With 25 units and a 12-month booking window, you’re managing 9,000 individual pricing decisions. Each one matters. Each one affects your bottom line. No human can optimize all 9,000 data points simultaneously.
This is the breakdown of exactly how we achieved a 22% revenue increase in May 2026, outperforming our markets by 16.75 percentage points. You’ll get the specific strategies, the market data by city, and the tactical changes you can apply to your own portfolio.
Want a personalized pricing audit for your portfolio? Get a free revenue report: freewyldfoundry.com/get-started
Key Takeaways
- Freewyld Foundry portfolios grew 22% YoY in May 2026 while the market averaged just 4.55%
- Occupancy increased 7 percentage points (51% to 58%) while ADR also increased simultaneously
- Airbnb’s new seasonal cancellation policies drove a sharp increase in booking velocity
- The World Cup failed to deliver expected demand in host cities, proving event pricing requires pace-based decisions
- Managing 9,000 pricing data points per 25-unit portfolio is not humanly possible without AI tools
- June 2026 is pacing 35% ahead of the same time last year
The Numbers: May 2026 Results
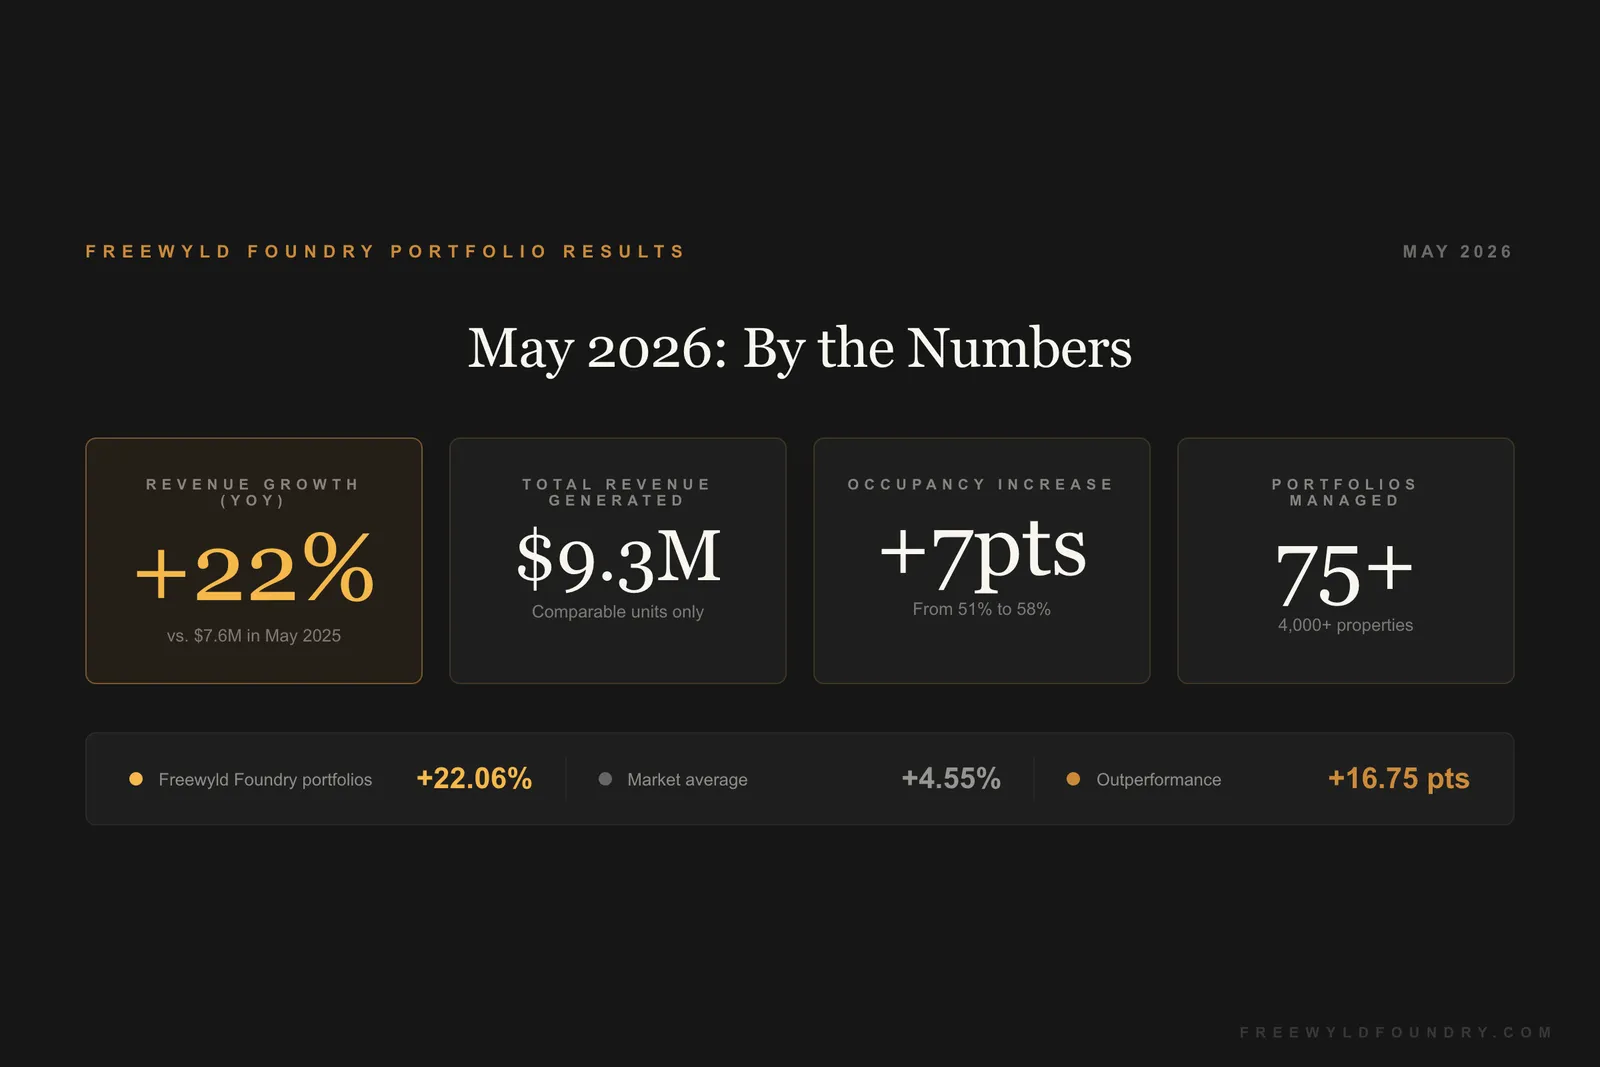
In May 2026, we drove $9.274 million in revenue across comparable client units. Last year the same units generated $7.598 million. That’s a 22.06% year-over-year increase.
To put that in context: the market average across the same period was up 4.55%. That means we outperformed the market by 16.75 percentage points. Not by luck. By applying a specific set of pricing and policy changes I’ll walk you through in this article.
A note on methodology: these numbers only count comparable units, meaning properties that were active last year with no owner calendar blocks or major changes. This is the only honest way to measure performance. Total revenue figures can look great just because you added more units.
| Metric | May 2025 | May 2026 | Change |
|---|---|---|---|
| Comparable Revenue | $7,598,000 | $9,274,000 | +22.06% |
| Average Occupancy | 51% | 58% | +7 points |
| Market Average Growth | Baseline | +4.55% | Baseline |
| Outperformance vs. Market | N/A | +16.75 pts above market | +16.75 pts |
The 22% increase came from three drivers: a 7-point occupancy increase, a simultaneous ADR increase (which most operators think is impossible), and an expanded booking window. Here’s what drove each one.
What Is AI-Powered Revenue Management for Short-Term Rentals?
The challenge is math. If you manage 25 STR units with a 12-month booking window, you have approximately 9,000 pricing decisions to optimize (25 units x 12 months x 30 days). For each of those 9,000 data points, the goal is to find the optimal price where a booking is likely but you’re not leaving money on the table.
Traditional dynamic pricing software tries to automate this completely. AI-powered revenue management takes a different approach: the tool analyzes patterns and flags outliers while humans make the final pricing calls.
Our AI tool scans the entire calendar daily, compares every price point to historical bookings and current market rates, and tells our revenue managers exactly which dates need attention. It flags things like: “The third week of September, you’re priced 35% higher than the highest price you’ve ever gotten for this unit. The market is priced much lower. Take that down.”
The result: our revenue managers can cover 75+ portfolios with the same depth of attention a manual process would require for 10 portfolios.
| Approach | Best for | Limitation |
|---|---|---|
| Manual Pricing | Under 10 units | Can't scale, misses patterns |
| Fully Automated | 10-50 units, low-touch | Systematic errors, no nuance |
| AI-Enhanced (Human-Led) | 25-500+ units | Requires setup and review process |
The key insight: this is a game of incomplete information. We never know if the perfect price is $156 or $162. But AI can tell us when we’re clearly out of range, and that’s where most of the money gets left on the table.
Seasonal Cancellation Policies: What Changed and Why It Matters
Airbnb introduced seasonal cancellation policies in May 2026, and this was likely the single biggest tactical change we made this month.
Before this feature existed, hosts had to pick ONE cancellation policy for their entire calendar. That created an impossible tradeoff: be flexible and get better search visibility, but risk last-minute cancellations on your highest-value dates. Or be firm and protect those dates, but take a search ranking hit year-round.
Seasonal policies eliminate that tradeoff. You can now be flexible most of the year and firm on the dates that actually matter.
The Two Strategies We Implemented
Strategy 1: Default Flexible with Protected High-Value Dates
Best for: Properties with booking windows under 60 days for most of the year, with only a handful of high-demand dates (holiday weekends, major events).
Set your default policy to Flexible or Moderate, then apply Limited or Firm only to specific high-value dates. Here’s what that looks like for a 3-bedroom beach house:
| Period | Policy | Reason |
|---|---|---|
| Jan to May | Flexible | Low season, maximize visibility |
| Memorial Day | Limited | Protect early-booked revenue |
| June to August | Firm | Peak season, long booking windows |
| Sept to Nov | Flexible | Shoulder season, encourage bookings |
| Thanksgiving | Firm | High-value, protect revenue |
| Dec 1 to 15 | Flexible | Encourage holiday bookings |
| Dec 16 to Jan 5 | Firm | Peak holiday season, protect |
Strategy 2: Default Firm with Tactical Last-Minute Flexibility
Best for: Large homes (6+ bedrooms) where peak season accounts for most of the year’s revenue and booking windows are consistently long.
Keep your default as Firm for most dates, but switch to Flexible or Moderate when you’re looking at dates within 2 weeks that still have gaps. At that point you’re not protecting much revenue anyway, and flexibility drives bookings.
The psychology matters here: if a guest books 3 months out on a Firm policy, they still have 2 months to cancel for free. That doesn’t feel locked in. But if they book 20 days out on a Firm policy, they’re immediately locked in with no free cancellation. That deters bookings. Adjusting to Limited or Moderate close-in solves this.
The Last-Minute Trap: Where Most Operators Lose Money
The last-minute trap is the most common and costly revenue management mistake we see. Here’s how it plays out:
You list a peak weekend at $250. The market rate for similar units is $180-$200. Nothing books. Three weeks out, panic sets in. You drop to $200, then $175, then finally $130 to guarantee a booking.
But here’s the thing: if you’d started at $185 four months ago, someone probably would have booked at $185. You just cost yourself $55 per night by wanting too much too early.
The fix is counterintuitive. Start lower than you want to at the top of the booking window, set a stepping-down schedule in advance, and book early at a good rate instead of late at a desperate one.
| Days Before Arrival | Example Price | Goal |
|---|---|---|
| 120+ days out | $180 | 20% above historical booking rate |
| 90 days out | $175 | Still above market, still competitive |
| 60 days out | $170 | Approaching market rate |
| 30 days out | $160 | At market rate, book now |
| 14 days out | $140 | Compete with remaining inventory |
| 7 days out | $130 | Priority is filling the unit |
Book at $170 in the 60-day window instead of $130 last-minute. On a three-night weekend that’s $120 in additional revenue. On 50 such weekends per year, that’s $6,000 per property. Multiply across a 25-unit portfolio and you’re looking at $150,000 in annual revenue that was being left on the table.
Market Performance by City: May 2026
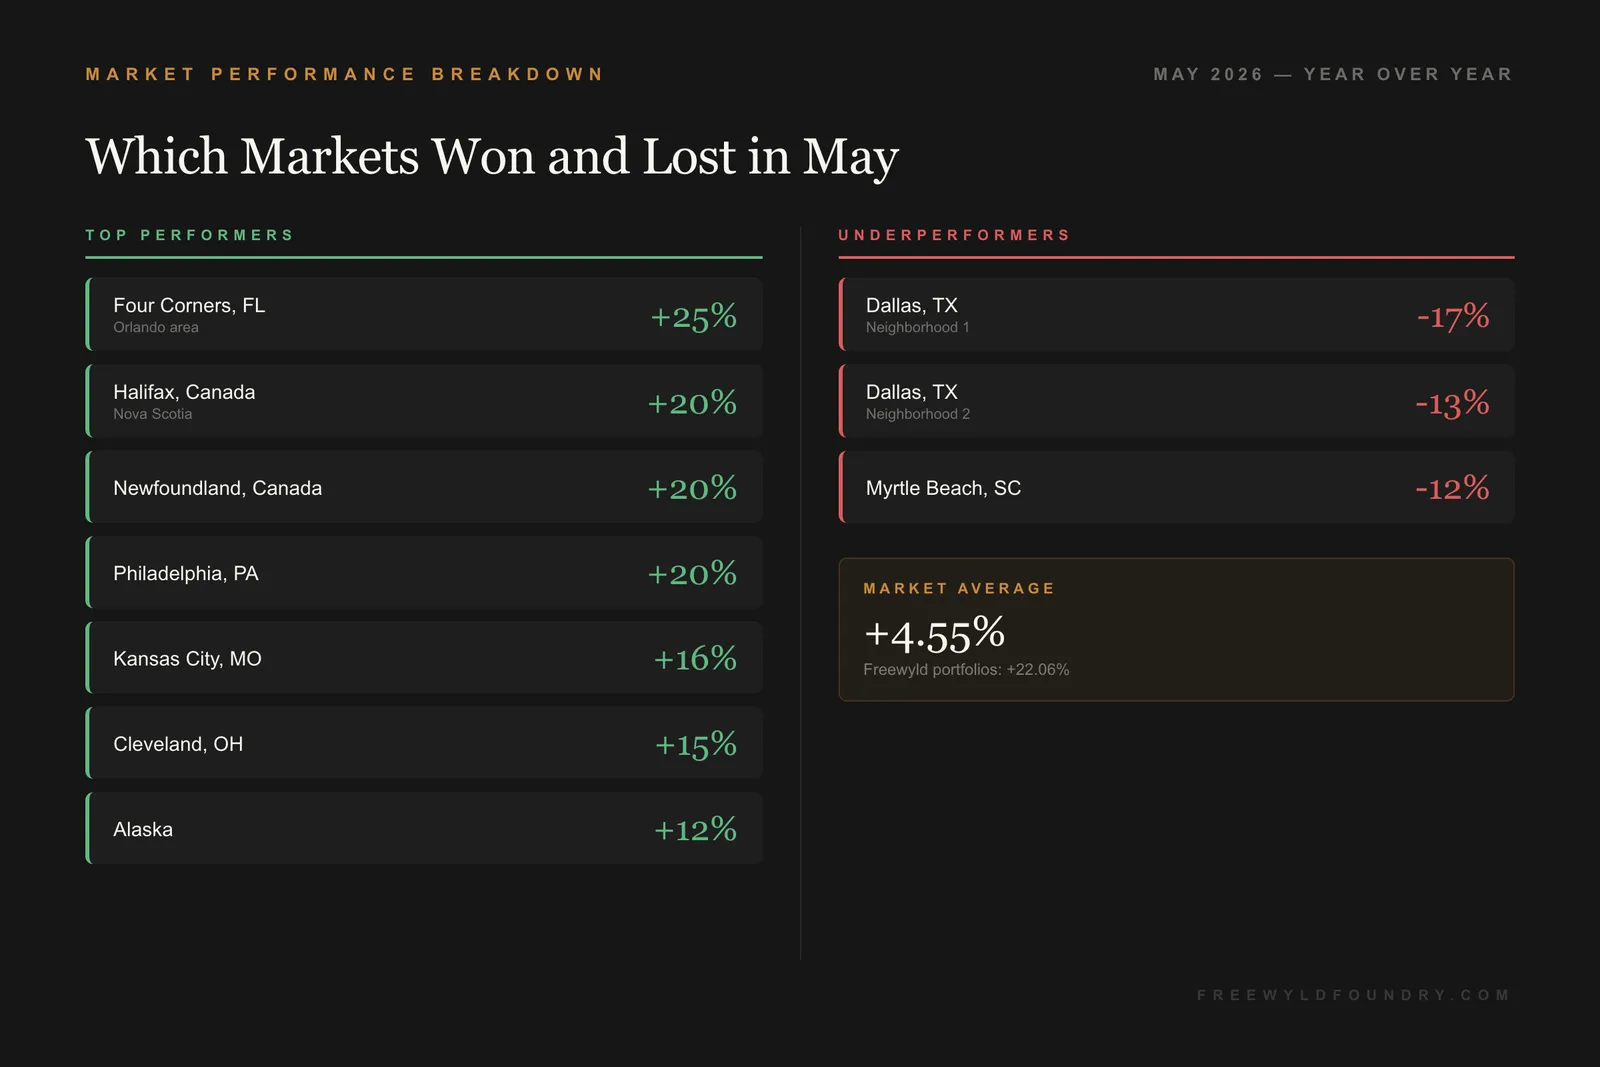
Not all markets performed equally. Here’s the full breakdown from our portfolios.
| Market | YoY Change | Notes |
|---|---|---|
| Four Corners, FL | +25% | Specific Orlando submarket |
| Halifax, Canada | +20% | Strong Canadian market |
| Newfoundland, Canada | +20% | Strong Canadian market |
| Philadelphia, PA | +20% | Secondary market outperforming |
| Kansas City, MO | +16% | |
| Cleveland, OH | +15% | Northern US markets strong |
| Alaska | +12% | |
| Milwaukee area, WI | +10% | |
| Market Average | +4.55% | Baseline |
| Myrtle Beach, SC | -12% | Underperforming |
| Dallas, TX (area 2) | -13% | Market-specific pressure |
| Dallas, TX (area 1) | -17% | Steepest decline in portfolio |
The pattern is clear: Canada and secondary US markets (Philadelphia, Kansas City, Cleveland) significantly outperformed traditional sun-belt destinations in May 2026. Most markets are within 5% of flat, which means the outliers on both ends are driven by local factors, not national trends.
The World Cup Disappointment
Houston, a World Cup host city, had LOWER occupancy on the books for June 2026 than June 2025. That’s not a typo.
Everyone raised prices 100-200% expecting event demand to fill inventory. Instead, they priced out the regular travelers who would have come anyway, and the international soccer demand wasn’t large enough to replace them at elevated rates.
The lesson: major events don’t guarantee revenue. Check if you’re pacing ahead or behind the prior year at 60+ days before the event. If you’re pacing behind, you’re overpriced. A 30-40% premium that books is worth more than a 150% premium that stays empty.
How to Track Performance: The Comparable Units Method
Most operators track performance incorrectly. They celebrate total revenue growth without accounting for portfolio changes, calendar blocks, or owner stays.
The right method splits every portfolio into two groups:
Comparable units: Active last year, no owner blocks, no major changes. These can be compared year-over-year.
Exclusive units: New additions, owner-blocked dates, renovated properties. Track separately, don’t include in YoY calculations.
When you know your comparable revenue is up 22% and the market is up 4.5%, you know your pricing decisions drove 16.75 points of that improvement. That’s signal you can act on.
Common Mistakes That Are Costing You Money
Using one cancellation policy year-round. Before seasonal policies, this was unavoidable. Now it’s a choice to take a search ranking penalty for no reason. Fix it.
Pricing based on market asking prices. Listing prices and booking prices differ by 30-50%. You’re competing with units that didn’t book. Price based on where units actually transacted.
Treating events as guaranteed windfalls. The World Cup proved this wrong. Pace-based decisions beat assumption-based decisions every time.
Not tracking comparable units separately. If you added 10 units this year, your total revenue growth means nothing. Separate comparables from exclusives.
Manual pricing at scale. If you have more than 10 units, you cannot optimize 9,000+ data points manually. You need AI assistance or you’re leaving money behind.
June 2026 Outlook
Our portfolios are currently pacing 35% ahead of the same time last year. Market averages for June are tracking about 6% up, roughly in line with May. If that holds, June should be another strong month.
Frequently Asked Questions
How much can revenue management realistically increase my income? Professional revenue management typically drives 15-25% revenue growth in the first year versus self-managed pricing. Properties using manual pricing with limited data see the largest improvements. Those already using dynamic pricing tools typically see 10-15%.
Do I need AI to price effectively? Below 10 units, manual pricing works fine. Above that, the math becomes unmanageable. With 25 units and a 12-month calendar, you have 9,000 pricing decisions. AI doesn’t replace your judgment, it makes your judgment scalable.
What’s the single biggest mistake most operators make? Starting prices too high at the top of the booking window, then dropping desperately close-in. Start at 15-20% above your historical booking price (not your asking price), price within 20% of where comparable units actually booked, and step down on a schedule.
How do seasonal cancellation policies affect my Airbnb search ranking? Airbnb heavily favors flexible policies in search. With seasonal policies, you can be flexible most of the year (better search ranking, more bookings) and firm on specific high-value dates (protected revenue). Properties that implemented seasonal policies in May 2026 saw immediate booking velocity increases.
Conclusion
The 22% result in May 2026 came from three things working together: AI tools that made 9,000 pricing decisions reviewable by a human in under an hour, seasonal cancellation policies that improved search visibility without sacrificing protection on high-value dates, and disciplined booking window management that got us away from last-minute panic pricing.
Three things you can do right now:
- Implement seasonal cancellation policies. Set your default to Flexible or Moderate, apply Firm only to your actual high-value dates.
- Start tracking comparable units. Separate your portfolio into comparables and exclusives. Calculate your true YoY performance independent of new additions.
- Escape the last-minute trap. Price 15-20% above historical booking prices 60-90 days out and step down on a schedule. Book early at a good rate.
The gap between operators who use data and those who don’t is growing. May 2026 showed a 16.75 percentage point difference. That gap will widen.
Want expert help implementing these strategies?
Get a free revenue report analyzing your specific properties and market. Our AI-powered analysis shows exactly where you’re leaving money on the table and how much you can improve. We work with portfolios doing $1M+ in annual bookings.
Listen to the Full Conversation
This article is based on the Get Paid for Your Pad podcast, Episode 719.
Listen to Episode 719: May STR Market Update