
The first episode of our Monthly STR Market Update series is here.
Every month, Jasper will share exactly what we’re seeing across 75+ client portfolios: which markets are up, which are down, what’s changed on the platforms, and what we’re doing about it. Real numbers, real portfolios, no fluff. Think of it as the monthly briefing you didn’t know you needed.
Want to outperform the market? Freewyld Foundry’s Revenue and Pricing Management service is driving an average 18% performance lift for $1M+ STR operators, even in down markets. If you’re managing 15+ listings and want a free pricing audit, apply here
In May 2026, Freewyld Foundry drove $9.3 million in revenue across comparable client units, a 22% increase year over year while the broader market averaged just 4.5% growth. That’s a 16.75 percentage point outperformance across 4,000+ listings and 75 portfolios worldwide.
That’s not luck. That’s what happens when you combine human expertise with AI tools that can analyze thousands of data points simultaneously. Our internal systems scan entire calendars, compare price points to historical bookings and current market rates, and flag exactly which dates need attention. The result: we increased occupancy by 7 percentage points (from 51% to 58%) while also increasing ADR. Most operators think that’s impossible because higher occupancy usually means lower prices. But when you escape the last-minute trap and book earlier in the window, you can drive both metrics up.
You will learn:
- How AI-powered pricing analysis enabled a 22% revenue increase versus 4.5% market growth
- The exact seasonal cancellation policy strategies that unlocked Airbnb’s algorithm favor
- Why World Cup host cities are seeing lower occupancy than last year, and what that teaches about event pricing
- The comparable tracking system that reveals which units are underperforming and why
- How to manage 9,000 pricing decisions per 25 units without going insane
We also talk about:
- Which markets performed best in May 2026 (Canada up 20%, Dallas down 17%)
- The math behind why humans can’t optimize pricing manually anymore
- How flexible cancellation policies drive bookings without increasing cancellation risk
- The difference between AI making decisions versus AI helping humans make better decisions
- Why June 2026 is pacing 35% ahead of last year despite World Cup disappointments
Mentioned in the Episode:
- Freewyld Foundry Free Revenue Report
- Claude AI
- Airbnb Seasonal Cancellation Policies (announced May 2026)
Subscribe for new episodes every Monday on YouTube, Spotify, and Apple Podcasts.

The STR Pacing Playbook
A step-by-step guide to tracking and using pacing data to optimize your short-term rental pricing strategy.
Download Free GuideContinue Listening
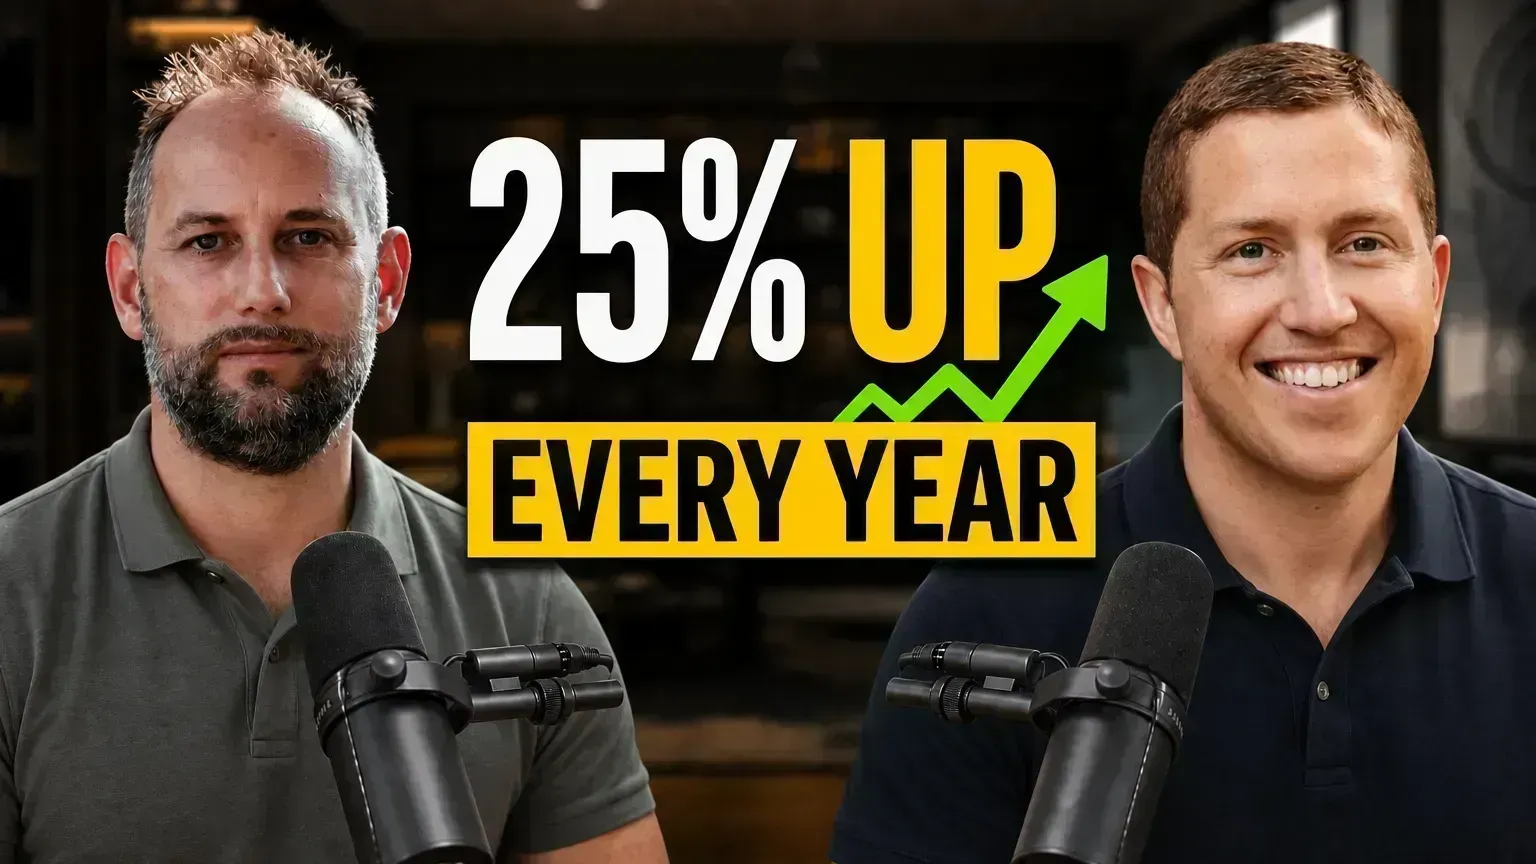
25% YoY Growth and 1.4M Travel Points From His Mortgage: David Dodge on Building a STR Portfolio
David Dodge started with one beach house in Lincoln City, Oregon in 2021. Three years later his portfolio is up 25% year over year and he's earning 1.4 million travel points annually from his mortgage payments using BILT. He and Jasper break down exactly how both happened.
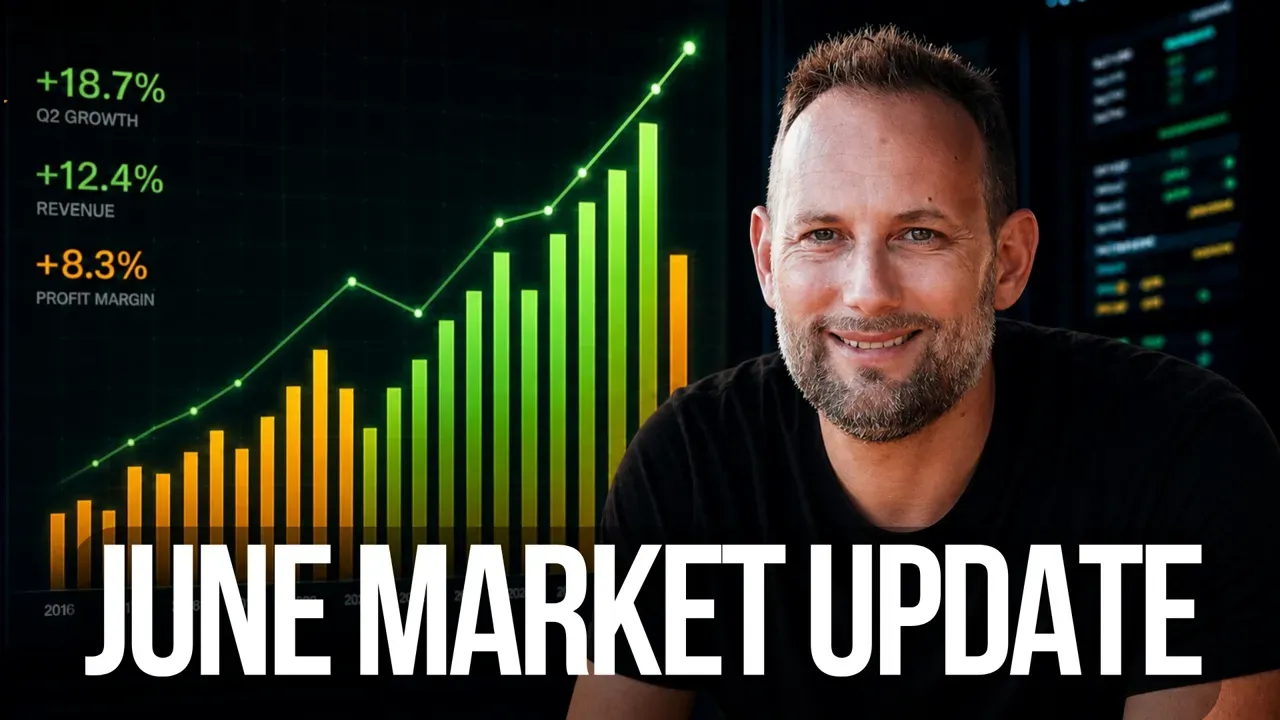
June STR Market Update: World Cup Impact and New Airbnb Discounts
The June market report is here. Freewyld's portfolios closed the month up 22.36% year over year, $14.4M in revenue across 75+ client properties, while the overall market averaged 9%. Jasper breaks down the gap market by market, covers what's coming in July, and explains a new Airbnb discount that just quietly launched.
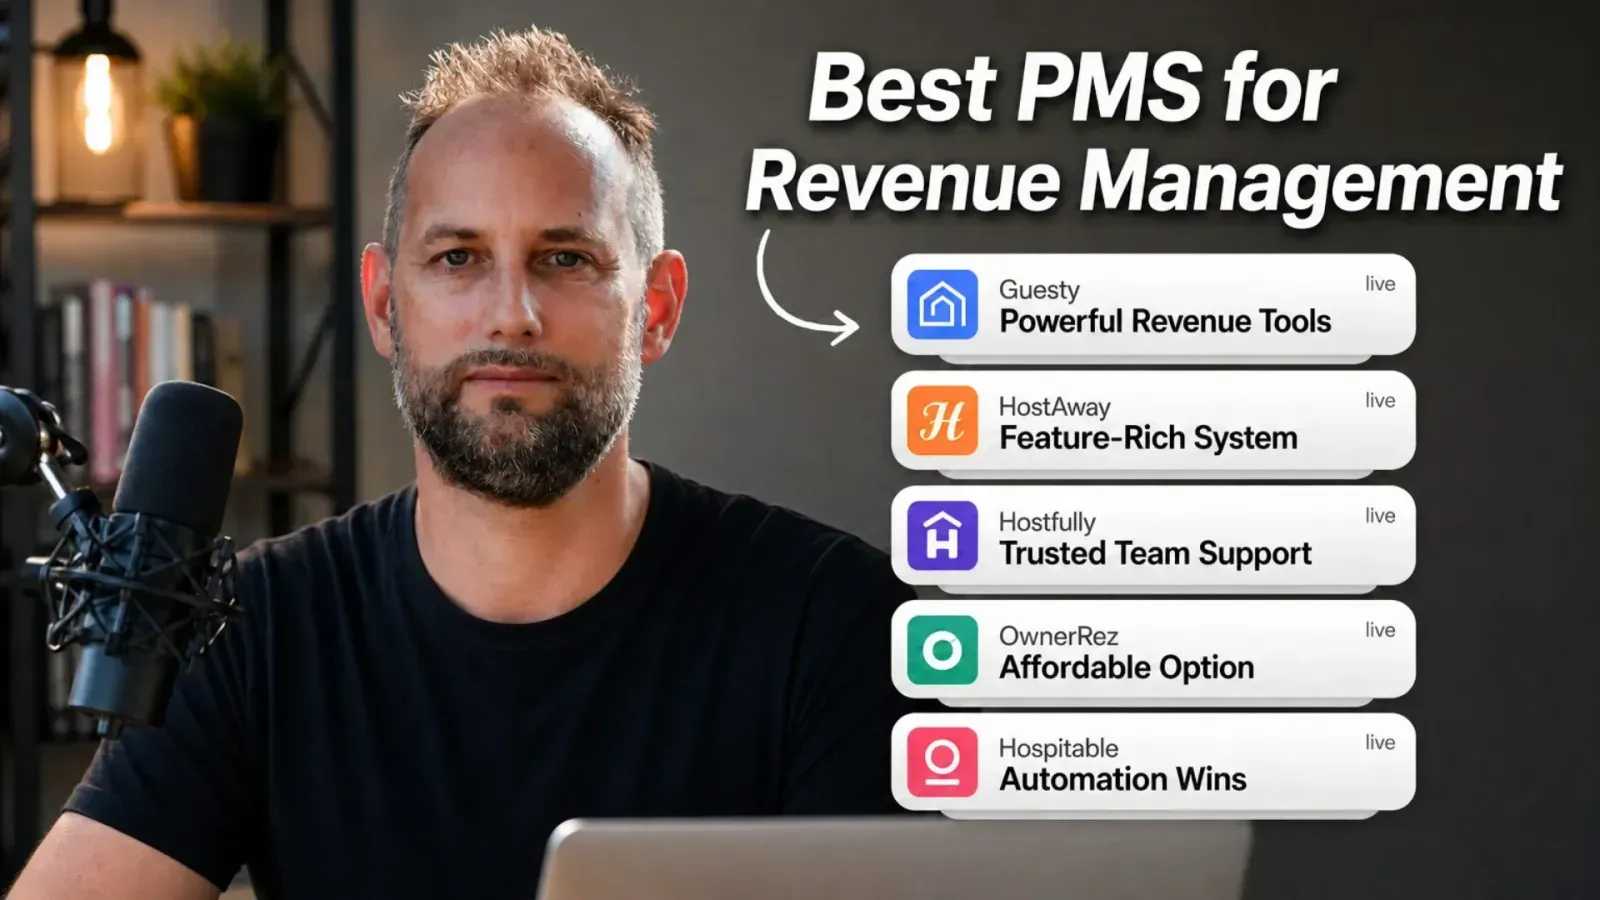
Best PMS Systems for STR Revenue Management
Jasper Ribbers manages revenue for 75+ STR companies and has worked inside nearly every PMS on the market. In this solo RevUp episode, he ranks the five systems Freewyld Foundry recommends, explains the criteria that matter most for revenue management, and covers the features that can limit your performance if you choose the wrong system.
The 22% Revenue Increase
In the month of May, we increased revenue for our client portfolios on average by 22%. You want to know how we did that? Keep listening.
Welcome back to Get Paid for Your Pad. Today is Monday, so we're doing an episode of Rev Up. And we're doing something new. I thought it was a good idea to share on a monthly basis, every month what we're learning, what results we're seeing, what trends we're seeing in the markets, any new features maybe that became available on the OTAs. And so today I'm going to do this first episode where I'm going to cover the month of May.
Why We're Starting Monthly Market Updates
I'm going to go through our results, different markets that we're in and how those markets were performing, what we learned, improvements that we've made, and a lot more. So yeah, excited to dive into this.
I think we are now at over 75 portfolios, around 4,000 homes that we're managing for clients across the world. And the amount of data that we are starting to gather now, especially with the help of some internal AI tools that we've been developing, that I'll touch on a little bit in this episode as well. We have now so much data. And so it really helps us to pinpoint which of our portfolios are performing the best, which are performing the worst, why are they performing that way? And so based on that, we're really learning a lot that we're using to increase the results for our clients.
And I think this last month of May, we've definitely seen a pretty strong increase in the improvement that we can make in terms of revenue for our clients. It was a record month for us. And I really think that the amount of data that we have and the analysis of that data in combination with some AI tools that we've built internally is really driving this result. So we have a little bit more clarity as well as like, where are these improvements coming from? So I want to kick it off by kind of sharing what I think were the main drivers of the revenue growth. I'll share some numbers as well.
The Numbers: $9.3 Million in May Revenue
So we did a total of 9.274 million of revenue for our clients in May. And these are just comparable units. So these are units that were active last year.
Maybe I should explain that a little bit more as well. The way that we track and the way that I recommend everybody who's listening tracks their results is we split up every single portfolio that we work with in two sections. Section number one is what we call comparables. Section number two is what we call exclusives.
How to Track Performance: Comparables vs Exclusives
So basically, what does that mean? A comparable unit is a unit that we can compare revenue year and year. If we have a unit that was active last year and there weren't any calendar blocks for owner stays, there was nothing outside of the pricing that would influence the revenue, either this month or last month. If none of that exists, then it's a comparable unit, right? And then we compare this month's revenue with last year's revenue.
Now we're also comparing to a lot of other stuff. We have a lot of KPIs that we track, but this is a very basic, important KPI to keep track of. Because if your unit last year did $5,000 in May and this year you're doing $4,000, then that could be an indication that there's something wrong, right? Because you're underperforming 20% compared to last year.
So you want to look at, hey, is there something wrong with the listing? Did we make a mistake on the pricing? You want to understand like why that difference exists in revenue, because then you can take action on it, right?
Similarly, on the upside as well, if you see like, hey, this unit performed 30% better than last year. What happened here? Is it something that we add something to the unit, that we add an amenity, that we add a bedroom or a bed? Well, bedroom is kind of hard to add, but like a bed. Is there something fundamentally different? How's the market performing?
If not, then it's probably a pricing thing, right? And so you might look into that and then find out, hey, our booking window went from like 15 to 20 days. If that's the case, then maybe we should look at our auto properties and see if we can expand that booking window for our auto properties as well. Might be like you were driving higher occupancy because you were allowing a lower minimum, or maybe you relaxed your minimum night stay settings.
It's really important to understand like where is the increase or decrease coming from? And you can only do that, of course, if you are actually tracking your year over year revenue for every single one of your units.
Breaking Down the Results
So we have for each of our clients, we have an internal dashboard that we built where we have those two sections, the comparables and non-comparables. When I talk about these increases, we're only looking at the comparable units, right? So it's a real fair apples to apples comparison.
This year, we're in May, we're at 9.274 million. And last year it was 7.598, which means there's an increase in year over year revenue of 22.06%.
Interesting to see how much of that is coming from the market, right? If the market's outperforming, that's going to help. If the market's underperforming, that's then going to be a headwind, right?
On average, the market was up 4.55% compared to last year. All right, so we're up 22%. The market was up, let's say, 4.5%, which means that we're outperforming the market on average by 16.75%.
Now, since we're in so many markets, I thought it'd be interesting to kind of look at, you know, which of the markets are performing really well, which of the markets are not performing well. But before I do that, I want to walk you through like where I think most of the improvement came from.
How We Increased Occupancy by 7 Percentage Points
Well, first of all, on average, we increased occupancy by 7 percentage points. It went from 51% to 58% across all of our portfolios, right? So 7% increase in occupancy that already drives, that's a significant driver for additional revenue.
Now, how do we increase occupancy? There's a couple of things. Number one is making sure that units are available and bookable, putting as little restrictions as possible, right? So most of the time when we onboard a new portfolio, we will make the minimum night stay settings more flexible.
And one thing that we implemented specifically this month is that we started using seasonal cancellation policies. We'll get to that later in this episode because Airbnb introduced that recently. But I think that was definitely a driver.
Increasing Occupancy AND ADR Simultaneously
And then another driver for the additional revenue because not everything came from occupancy. We're also on average able to increase the ADR as well. That's a really nice position to be in where you can increase occupancy and you can increase ADR at the same time.
Because typically increasing occupancy means decreasing prices. But if you are able to expand your booking window, then you can often increase ADR and occupancy because you're just getting your bookings earlier in the booking window when people are paying a higher ADR.
That's a part of our strategy as well is making sure that we're not falling into what I call the last minute trap where we have to fill too many units last minute when everybody else is dropping the prices, right?
So I think those are like some major contributing factors that I've seen.
The Role of AI in Revenue Management
Another thing that's really helping is internal tools that we've built using AI. If you have 12 months of availability in your calendar, and let's just say you have 25 units, right? Just to keep it simple.
If you have 25 units and you have 12 months of calendar that's open, that's bookable, that means you have 12 times 25 is 300 months of pricing to cover. Every month has, let's say, 30 days. So 300 months times 30 days, that is 9,000 data points.
If you have 25 units and your calendar is open for 12 months, then you're going to have to roughly manage 9,000 data points when it comes to pricing.
What Optimal Pricing Really Means
And your goal is for each of those 9,000 data points to be optimal. What is optimal? Optimal in our perspective is at a price where if someone would book it, it's a win for you. But you're also priced at a price point where it's reasonable to expect that somebody could choose your unit.
So essentially what it means is we're not overpriced to the point where it's very unlikely that somebody would book us because we're just overpriced. So much higher than similar units in our market that, yeah, it's possible that someone might book our unit. If we have a very unique product, then it's possible. But if our unit is not super special, then we can't really expect somebody to pay significantly more than what other units are priced at.
Obviously, we don't know for sure what those price points are. But if you have like a standard kind of two-bedroom unit and it's priced, let's say, I'm just naming like Thanksgiving. Let's say you're priced at $200. And the whole market is, all the other two bedrooms in your market are priced around like $100 to $150. It's just very unlikely that your unit's going to get booked, right?
And so that means your price is not competitive. It's not optimized. Because essentially like that unit is not going to book at that price.
The Last-Minute Trap
What's going to happen is at some point you're going to get closer to Thanksgiving, maybe a month out, maybe two weeks out. You're going to look and you're going to be like, hey, this is not booked yet. Let me drop it. But now you're going to drop it to like $150, $125. And now you might have to set it at $100 on the lower range of kind of our people were booking.
But if you were maybe at $150 earlier in the booking window, somebody might have booked at $150. And now you might have to book it at last minute at $100, right? So that's a big difference, right? That's a $50 difference.
So the point is you want to be at a price where it's reasonable for people to book your unit. But also you don't want to be underpriced. You don't want to offer it at $100, you know, four or five months out. Because then, yeah, you're going to get booked very quickly. But now you could have gotten booked at a higher price.
Pricing as a Game of Incomplete Information
So we never know exactly what the optimal price point is. But by looking at where did our units get booked in the past? Where are similar units priced in the market? How many bookings have we gotten already for other units in your portfolio? How is the market pacing? Is there more demand than last year? Is there less demand?
There's a lot of factors that you can use to make an educated guess on like what will be the optimal price point? Or at least like a range, right?
I mean, we don't know if the optimal price point is $156 or $162. I mean, nobody knows. At the end of the day, the person that is going to travel to your market decides what unit they book and what price they're paying. So we don't know. This is a game of incomplete information, right?
But if we're booked for Thanksgiving in the past few years, let's say at like around $150 and similar units are priced around there. Well, maybe we put it at like $180, four or five months out. Let's see if we can get 20% more than what we've gotten in the past.
If you put it at $180, it's a win if somebody books it because it's 20% higher than where you got booked at last year. It's 20% higher than where the market is priced. But it's not unthinkable. You know, I mean, somebody, if they like your unit a little bit more than other units, then somebody might pay $180, right?
And then slowly we'll lower it to maybe $175, $170 according to where we are in the booking window.
How AI Helps Manage 9,000 Data Points
Now, obviously, 9,000 price points is a lot to manage for one person. And that's just on 25 units, a portfolio of 25 units. Well, that's where AI comes in. So we've built internal AI tools that can help us with this.
So our AI tool can literally scan the entire calendar and compare all of our price points to previous year's bookings, to where the market is, and tell us exactly what dates we should be looking at.
It will tell us like, hey, the third week of September, you're priced 35% higher than the highest price you've ever gotten for this unit. The market is priced much lower. You probably want to take that down a little bit.
Our revenue managers are now able to make better price decisions because the tool can see more than what we can see. As a human being, we're limited on the amount of data that we can process. AI is amazing at that, right?
Human-Led, AI-Enhanced Approach
I don't think we want to really leave it to AI to make the pricing decisions because there's so many different nuances when it comes to pricing. That's not where we are at right now. We still have a human-led approach to pricing, but we are leveraging the tools to make better pricing decisions.
So that's a little bit about how we were able to drive this really good result. We're very happy with this.
Market Performance Breakdown
Next is average. The markets that we're in, the markets were up over 4.5%. But obviously, one market's up, one market's down, etc. So I want to pick the outliers.
So I would say on the positive side, the highest increase in any market that we're in, I'm seeing in Canada. Actually, we have several portfolios in Canada that perform pretty well. One market, Halifax, is up more than 20%. We're in Newfoundland where the market was up more than 20%.
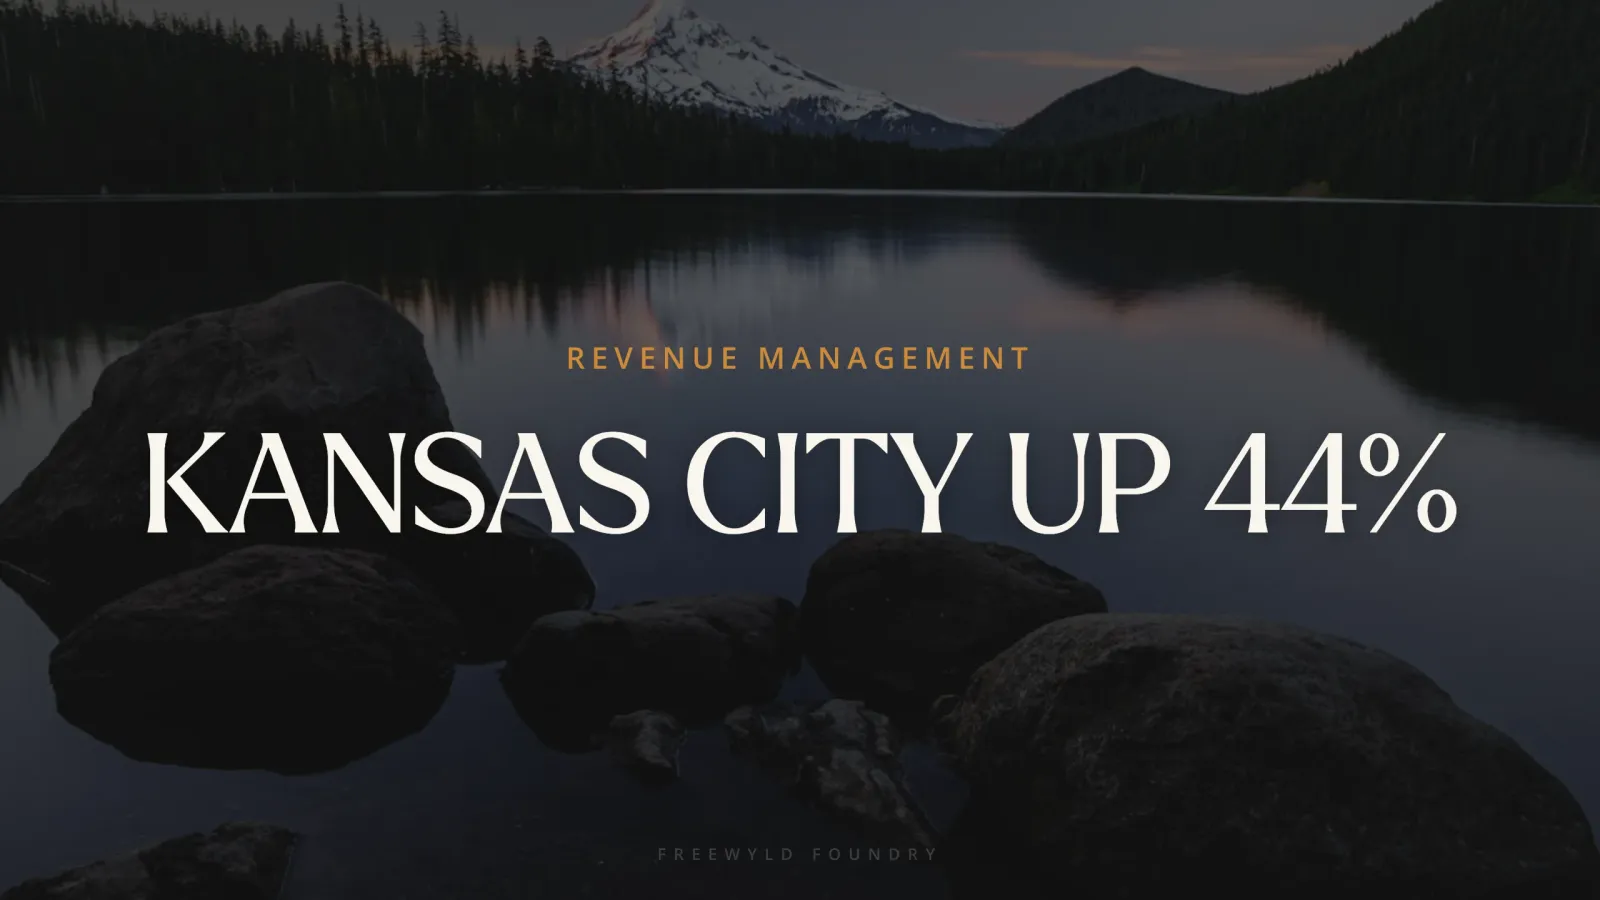
Philadelphia is up around 20%. Kansas City, I'm seeing up about 16%. We have a few markets in Australia that are up around 15%. Another few areas in Canada. Seems like Canada is doing pretty well. So Canada is definitely seeing an increase in performance.
Seeing some of the northern states in the U.S. did pretty well in May. I'm seeing the area around Cleveland is up about 15%. I'm seeing Alaska up about 12%. Michigan. I think it's Michigan or Wisconsin. There's an area near Milwaukee. I think it's Wisconsin, actually, which is up just over 10% or so.
We have a portfolio near Orlando. And Orlando is huge. You can't really say Orlando is up X% because it's so large. It's so different. Like downtown Orlando is completely different than some of those Disney areas, for example. Right? So we're in a very specific little corner. I think it's called Four Corners. And it seems like that market was up about 25%. But it's very possible that another area of Orlando might actually be down. It's just a very diverse market.
Markets That Underperformed
Now, let's look at the outliers on the downside. We see Dallas down about 17%. And again, this is based on where our units are located. Right? So like one neighborhood in Dallas might be different from another neighborhood in Dallas. But I do think it gives kind of like an indication of how the markets are performing.
Myrtle Beach down about 12%. Another portfolio in Dallas, which is down 13%. So there you go. Units in different areas is down 13%. Different area was down 17%.
Those are really the ones that we see down the most. So there's not a lot of markets that are down double digits. It's literally only a handful of markets that we're seeing down. So overall, most of the markets are pretty flat. And most of the markets are up or down like 5%. So nothing too extreme.
Looking Ahead to June
Now looking ahead into June, we are currently pacing about 35% over the same time last year. So that's looking really good. The market is in June. On average, our markets are up 6%. Next month when I do this episode, well, I'll let you know what the final results are.
But it seems like the markets on average in June are performing at this point about the same as May.
The World Cup Disappointment
We were expecting a big boost from the World Cup. But that demand for the World Cup is absolutely not materializing. I spoke about this in a different episode. But yeah, we're seeing the demand for the World Cup is really lagging.
I mean, there's markets like Houston where there's actually less occupancy on the books for June than last year. And I think it's because everyone has raised their prices so much that it's deterring non-World Cup people from traveling to these cities.
I think that's really dampening demand. And the international or the World Cup demand is just not large enough. There's not enough demand just from the traveling for the World Cup to really fill up the occupancy with those elevated prices.
So we've been getting a lot more aggressive, you know, to fill our units for the World Cup.
That's a little bit about the market overview and trends that we're seeing.
OTA Updates: Seasonal Cancellation Policies
On the OTA side, I want to also give some updates every month and let you guys know like, hey, is there anything new? Anything that you should pay attention to?
Well, I think the biggest change is really the seasonal cancellation policies. So the way that we have implemented that and we are implemented that, it's pretty new. So we're still in the process of kind of implementing that strategy throughout all of our portfolios. But we've tested some different strategies and we've seen really good results. So we're now going to implement that across the board.
But essentially what we're doing is instead of just having one default cancellation policy for the entire calendar, we can now offer a more flexible cancellation policy. But we can, for the high value dates, so really the dates where we want to protect the revenue, where the booking window is much longer. So like think your peak season, potentially your high season, and then your events, right? Your Christmas, your Thanksgiving, your concerts, your college football, like those type of events.
We can protect those with a firm or a limited cancellation policy and then put the rest of the year either on flexible or moderate. So that's one strategy that we've been using where we've just crossed the board at a more flexibility.
What Actually Changed with Airbnb
So one of the biggest updates that we've seen this month or the month of May was the seasonal Airbnb cancellation policies that were introduced. Okay, so we started applying that a few different strategies to different portfolios.
So I'll walk you through the strategies that we've implemented that we've seen really good results with. And we are now implementing those strategies across the entire portfolio, all of our portfolios.
So let me first touch on what actually changed, right? So Airbnb introduced seasonal cancellation policies. Now, this is something that users, hosts have been asking for, for a very long time, because it was a major flaw on the functionality of Airbnb to not be able to choose different cancellation policies for different times of the year. And it prevented a lot of hosts from adopting the more flexible cancellation policies.
Now, Airbnb's goal is to be a very user-friendly platform. They want the guests to have a seamless experience on their platform, and they want the guests to have a lot of flexibility when it comes to canceling their stay. Just like most hotels, you can cancel up to a day in advance.
And Airbnb really wants to have that flexibility as well, because in the end of the day, Airbnb is kind of competing with hotels. And also, they just want to get more users on their platform, right? So flexible cancellation policies is great for the guests. Guests love flexible cancellation policies.
How Airbnb Favors Flexible Policies
The units that have more flexible policies, a while back, they removed the strict cancellation policy option. So that's no longer available. Some hosts are still using it because they've been using it for a long time. Airbnb allowed hosts to continue to use the strict cancellation policy, but it's no longer an option now.
So you can choose between firm, limited, moderate, and flexible. There's a couple of exceptions. There's like a super strict 30, super strict 60, or something like that. But really, those policies should not be used unless in extreme circumstances, because Airbnb is heavily favoring the units that have flexible cancellation policies in their algorithm.
And I think with the introduction of the seasonal cancellation policies, hosts now don't really have an excuse anymore to not offer that flexible cancellation, because they're able to protect their higher value dates with more strict cancellation policies.
So the argument of like, hey, yeah, I would love to offer flexible cancellation policy, but I don't want somebody canceling the night before, one day in advance for like Thanksgiving, Christmas, peak season, etc. Because then I have to book it at a much lower price. The owner of that property is going to be mad at me. I might lose a client, etc. So that argument is now no longer valid.
And with that, I think Airbnb is pushing the flexible cancellation policies more in their search algorithm. That's what we've really seen is sharp increase in bookings on the properties where we're using these more flexible cancellation policies.
Strategy One: Flexible Default with Protected High-Value Dates
And so there's really like three strategies that we're implementing. Number one is the units where we only have a few limited amount of days where we really have to protect revenue. The booking window is not super long, except for like a few particular dates, right?
So for example, we might have a booking window of like, you know, 15, 20 days most of the year. But then like for college football, it's like much longer for Christmas. It might be much longer for Thanksgiving.
So what we want to do is we want to offer a very flexible cancellation policy, either flexible or moderate for the entire year, except for those high value dates where we would either have a limited or a firm policy.
So that's the first strategy, just overall making it very flexible. Setting the default is flexible. And then just kind of picking a few dates where that you want to protect a little bit more.
Strategy Two: Large Homes with Long Booking Windows
On the flip side, for the larger homes, let's say you have like an eight bedroom or a six bedroom in the Smokies or on the beach somewhere. Like those homes, they get booked so far in advance for pretty much the entire high season, right? The summer, but then also for Christmas and Thanksgiving and maybe spring break or maybe even like some other school holidays.
So here it's more like the opposite side where you kind of want to protect most of the year, but there are some low season months where you might be offering a more flexible policy.
Now, if you have a six bedroom or eight bedroom house, you might still not want to go completely too flexible, but you can keep the default as firm or the default is limited. But now you can use last minute, you can offer a more flexible cancellation policy.
Like let's say you have an eight bedroom house in Pigeon Forge or something like that, a Gatlinburg, and you're like, hey, you're looking at your calendar and there's like, there's a couple of weekdays that are unbooked next week. Well, you might as well offer that a flexible because there's, you know, there's not much revenue to protect.
The chance that that's going to get booked is not great in the first place. And I mean, if people book a week in advance, yeah, if they cancel, so be it. But we're not so worried about the cancellation. We're more worried about just getting it booked in the first place.
Last-Minute Flexibility for Gap Dates
So if you're more worried about getting it booked, then it makes sense to just offer the most flexible cancellation policy that's available. You can do that for the next couple of weeks. You can just look at the gaps in your calendar and you could just decide, hey, you know what? If it's like two weeks out, maybe put it a moderate. If it's a week out, you might put it on flexible, right? If it's four weeks out, you might put it on limited.
The whole idea is that people don't like to be locked in the moment that they book. If you're on firm, that means like the guest is basically locked in 30 days out. So if you're then at 26 or 27 days out till check-in, the difference between firm and limited is literally like the guest is locked in or the guest is not locked in yet.
The Psychology of Cancellation Policies
I think it's always good to manage your cancellation policies in a way that when the person books, they still have some time to cancel. So if they book two months out, three months out, then firm is perfect because they still have one or two months that they can cancel for free, right?
So it's not going to deter them from making the booking because psychologically they feel, oh, I still have plenty of time to cancel. So the firm cancellation policy, I don't think it's going to hurt bookings if it's very far out.
But if you're three weeks out, now the booker is immediately locked in. So then you might want to put it on limited so that they have at least they have one week where they can cancel for free.
So that's kind of how to think about these cancellation policies. So those are really the two strategies that we were implementing. It's either you set a very flexible and you protect the high value dates with a stricter policy or you keep it strict, but you're just adding more flexibility on select areas in the calendar.
So I guess there's two strategies. I think I may have mentioned there's three, but these are really the two strategies that we've been implementing so far. And we've seen really good results.
Algorithm Favor for Flexible Policies
And that kind of confirms my suspicion that with the introduction of these seasonal cancellation policies, Airbnb is now favoring the flexible policies more in their search algorithms. I've seen some posts on social media that talked about this. Now, you never know if that's true and where are people getting the information. And a lot of times it's like kind of marketing stuff that people put out there.
But I think there's truth to it. I've definitely seen a positive impact from implementing these seasonal cancellation policies.
So I think that's the biggest update I've seen on the OTA side.
Minor Airbnb Interface Updates
I also noticed that Airbnb changed the way that you add custom promotions a little bit. They just shifted around the categories on the calendar. If you're trying to do Airbnb custom promotions and you can't find it, it's now under discounts. And there's a specific section for discounts where you can now find it.
So the functionality has changed a little bit. I don't know if this is an old account yet, but because it's literally a couple of days ago that I saw that for the first time. But that's something that I think has changed as well.
Wrapping Up and How to Work with Us
So, okay, this is the end. This is the update for the month of May. Again, I'm going to do one of these updates every single month. So to keep you in the loop on what we're noticing, how our portfolios are performing, how we are doing as a company, what we're seeing in the markets, and any updates that we're seeing that we think you should focus on.
So hope you enjoyed this episode. Of course, if you are interested in working with us on the revenue management side, you can do a free audit, get a free report for your portfolio. You go to freewyldfoundry.com/get-started. And there you can just put in your details and we will do a free revenue report for you.
We've developed a pretty awesome tool where AI is helping us doing these reports. And we can get pretty accurate predictions of how much we think you can increase the revenue on your portfolio.
Now, we only work with people that do at least 1 million in book value per year. If you're a little bit lower, you can still apply for the report and we'll still do it, especially if you're growing. But as a general rule, we only work with companies that are doing at least a million.
So go ahead and request that report. We'll give you insight on how you can improve. If we think it's a win-win, we don't work with just anybody. We're selective with who we want to work with. We want to make sure that it's a win-win for both parties. But if we do think it's a win-win, then we'll let you know how we can work together.
As I mentioned, we're currently at around 75 clients worldwide, about 4,000 homes under management. And we're growing pretty fast. We've grown about 50% since January.
The Importance of AI in STR Management
Yeah, pretty exciting. We're working on a lot of stuff. As I mentioned, AI side, really starting to leverage a lot of different tools that we build with Claude. And if you haven't used Claude yet, I highly recommend it. It's an amazing, amazing tool.
And I really think that people who are not leveraging AI are going to be falling behind.
So with that said, I appreciate you. Thank you for listening. And we'll be back next Monday with a regular episode of Rev Up. And then the next month, we'll do another overview episode for the Month of June.
So thanks for listening. We'll see you next time.
Related Articles
STR Market Update June 2026: World Cup Impact, Top Markets, and Airbnb's New Discounts
Freewyld Foundry's portfolios finished June up 22.36% year over year while the overall market averaged 9%. Here is where the gap came from, which markets outperformed, and what Airbnb just changed that could affect your pricing strategy.
The 5 Best PMS Systems for STR Revenue Management (Ranked)
Freewyld Foundry manages 4,000+ listings across 75+ companies worldwide and has worked inside nearly every PMS on the market. Here are the five systems we actually recommend for revenue management, and what to look for before you choose.
How to Outsource STR Revenue Management Without Wasting Time and Money
Most STR operators who outsource revenue management end up worse off than before. Here's the checklist we built after reviewing 1,000+ companies: what to have in place before you hire in-house or work with a service provider.