How to Track Short-Term Rental Results: The Complete Guide to Revenue Management KPIs
If you’re not tracking results effectively, you’re not really managing revenue. You’re guessing.
Most short-term rental operators understand that tracking performance is important. But here’s what we’ve discovered working with operators managing portfolios from 15 to 300+ units: very few actually know what to track, how to track it, or how to make decisions based on the data they collect.
This gap between knowing you should track results and actually doing it correctly costs STR operators thousands of dollars every month. Worse, it creates a false sense of confidence when operators celebrate revenue growth that’s actually underperformance relative to their market.
In this guide, we’ll break down Freewyld Foundry’s proprietary approach to tracking performance across 4,000+ listings managing $190M+ in annual bookings. You’ll learn exactly which KPIs matter, how to compare apples to apples when your portfolio changes, and why tracking the wrong revenue metric can make you think you’re down 50% when you’re actually up.
Want to know where your portfolio stands? Get a free revenue report analyzing your performance with personalized recommendations.
What Is Revenue Management Performance Tracking?
Revenue management performance tracking is the systematic measurement and analysis of key performance indicators (KPIs) to understand how your short-term rental portfolio is performing compared to past periods, market benchmarks, and your own properties.
According to Jasper Ribbers, co-founder of Freewyld Foundry, “Revenue management is making decisions based on uncertainty. So the more information that we can get, the better our decisions.”
The challenge most operators face is not whether to track performance, but rather establishing a framework that delivers actionable insights instead of just data points. Understanding how to track short-term rental results properly is the foundation of profitable decision-making in this industry.
Why Most STR Operators Track Results Incorrectly
The biggest mistake in STR performance tracking is focusing on total revenue without context. Here’s a real example that illustrates why this matters:
Last year in February, your property generated $3,000 in total revenue. This year, you generated $2,000. On the surface, you’re down 50%, which looks terrible.
But what if last year you had 30 one-night bookings with a $75 cleaning fee? That’s $2,250 in cleaning fees alone, which are pass-through costs. You didn’t actually make that money since it went straight to your cleaning crew.
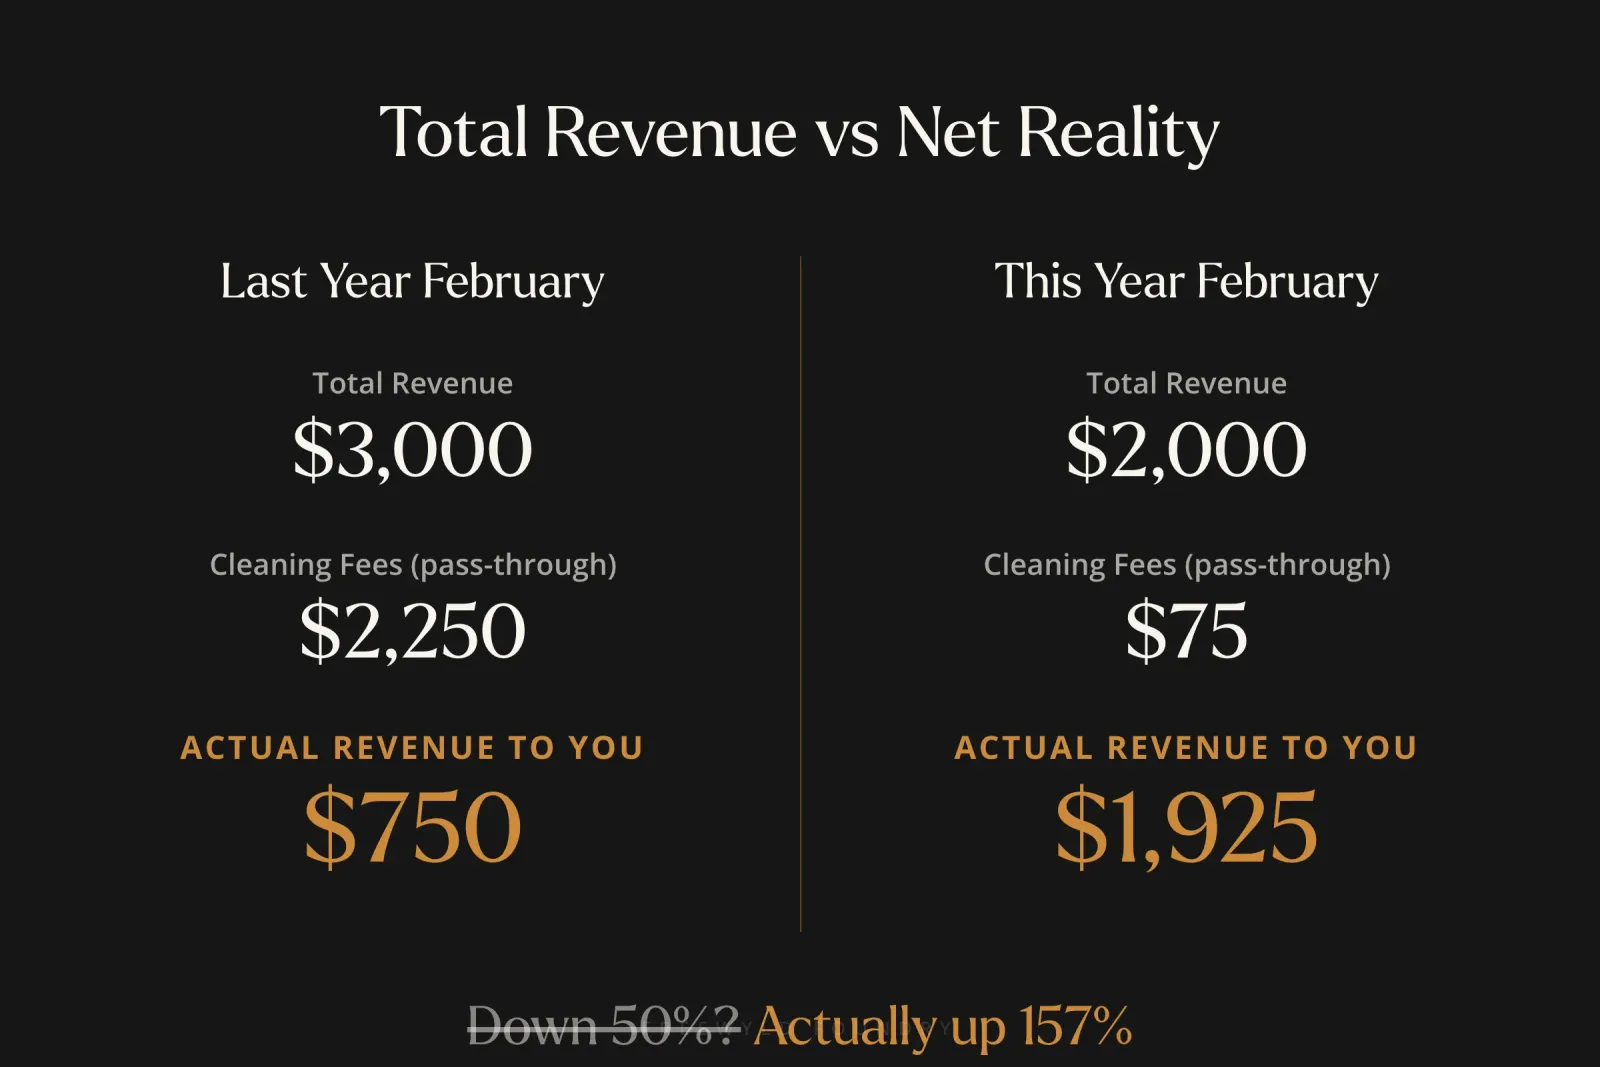
This year, if you had one booking for the entire month with a $2,000 payout, you actually made significantly more money because only one cleaning fee was included.
This is why tracking total revenue (your payout including all fees) can create a completely distorted picture of actual performance.
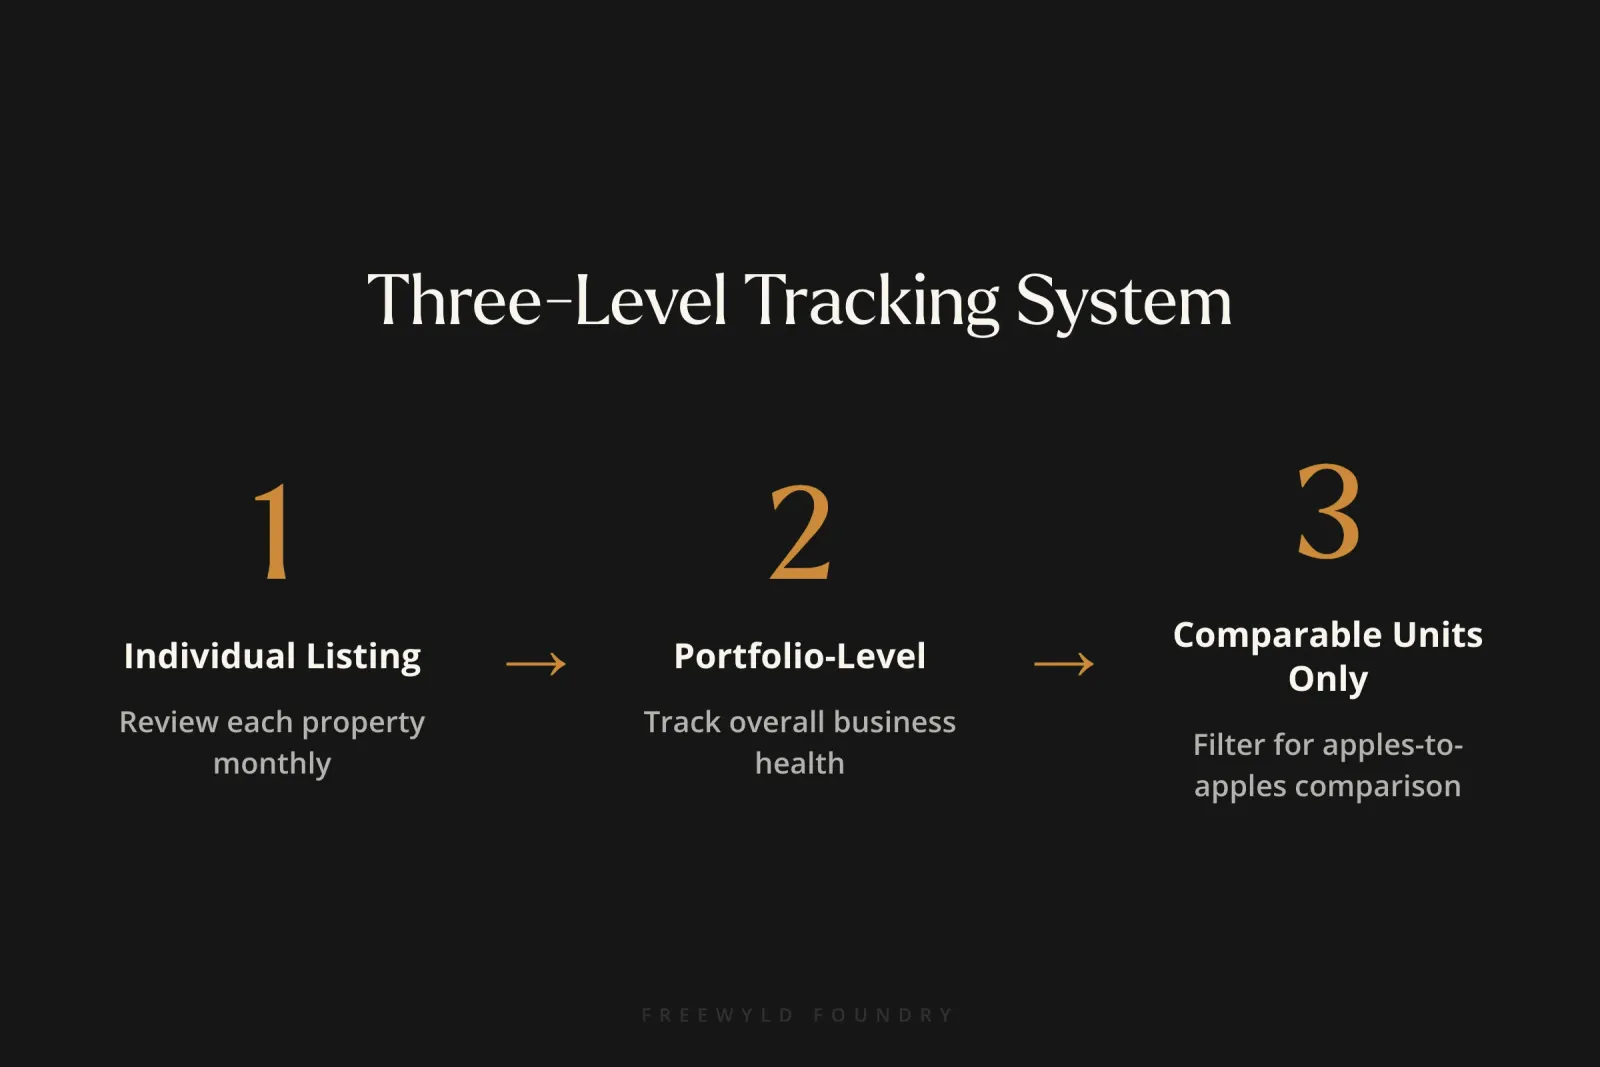
The Three Levels of STR Performance Tracking
Freewyld Foundry uses a three-level tracking system to get complete visibility into portfolio performance:
Level 1: Individual Listing Performance
Review every single listing’s performance each month. This allows you to:
- Spot underperforming listings quickly
- Diagnose root causes (pricing, marketing, distribution, reviews, outdated amenities)
- Identify overperforming listings to reverse-engineer what’s working
- Make targeted improvements rather than broad portfolio adjustments
“Every month you should look at results from the previous month,” says Ribbers. “You should do that for every single listing. That way you can spot listings that are not performing as well.”
In PriceLabs, use the Leaderboard report to review KPIs for any given month, or build custom reports to track individual unit performance.
Level 2: Portfolio-Level Performance
Look at your entire business performance to understand overall health and trajectory. This gives you the big picture view of how your company is doing.
The challenge with portfolio-level tracking is that it becomes meaningless when your portfolio constantly changes. Adding new properties every month makes year-over-year comparisons impossible without proper filtering.
Level 3: Comparable Units Only
This is the most sophisticated level and where most operators fall short. To make fair year-over-year comparisons, you need to filter for truly comparable units.
A comparable listing must meet these criteria:
- At least 12 months of historical data (preferably more)
- Similar bookable nights year-over-year
- No major anomalies (one-star reviews, extended owner blocks, significant renovations)
At Freewyld Foundry, we create custom dashboards with two sections: “Comparables” and “Non-Comparables.” This allows true apples-to-apples comparison and is essential for mastering revenue management strategies that actually work.
What KPIs Should You Track for Short-Term Rentals?
Essential Performance Metrics
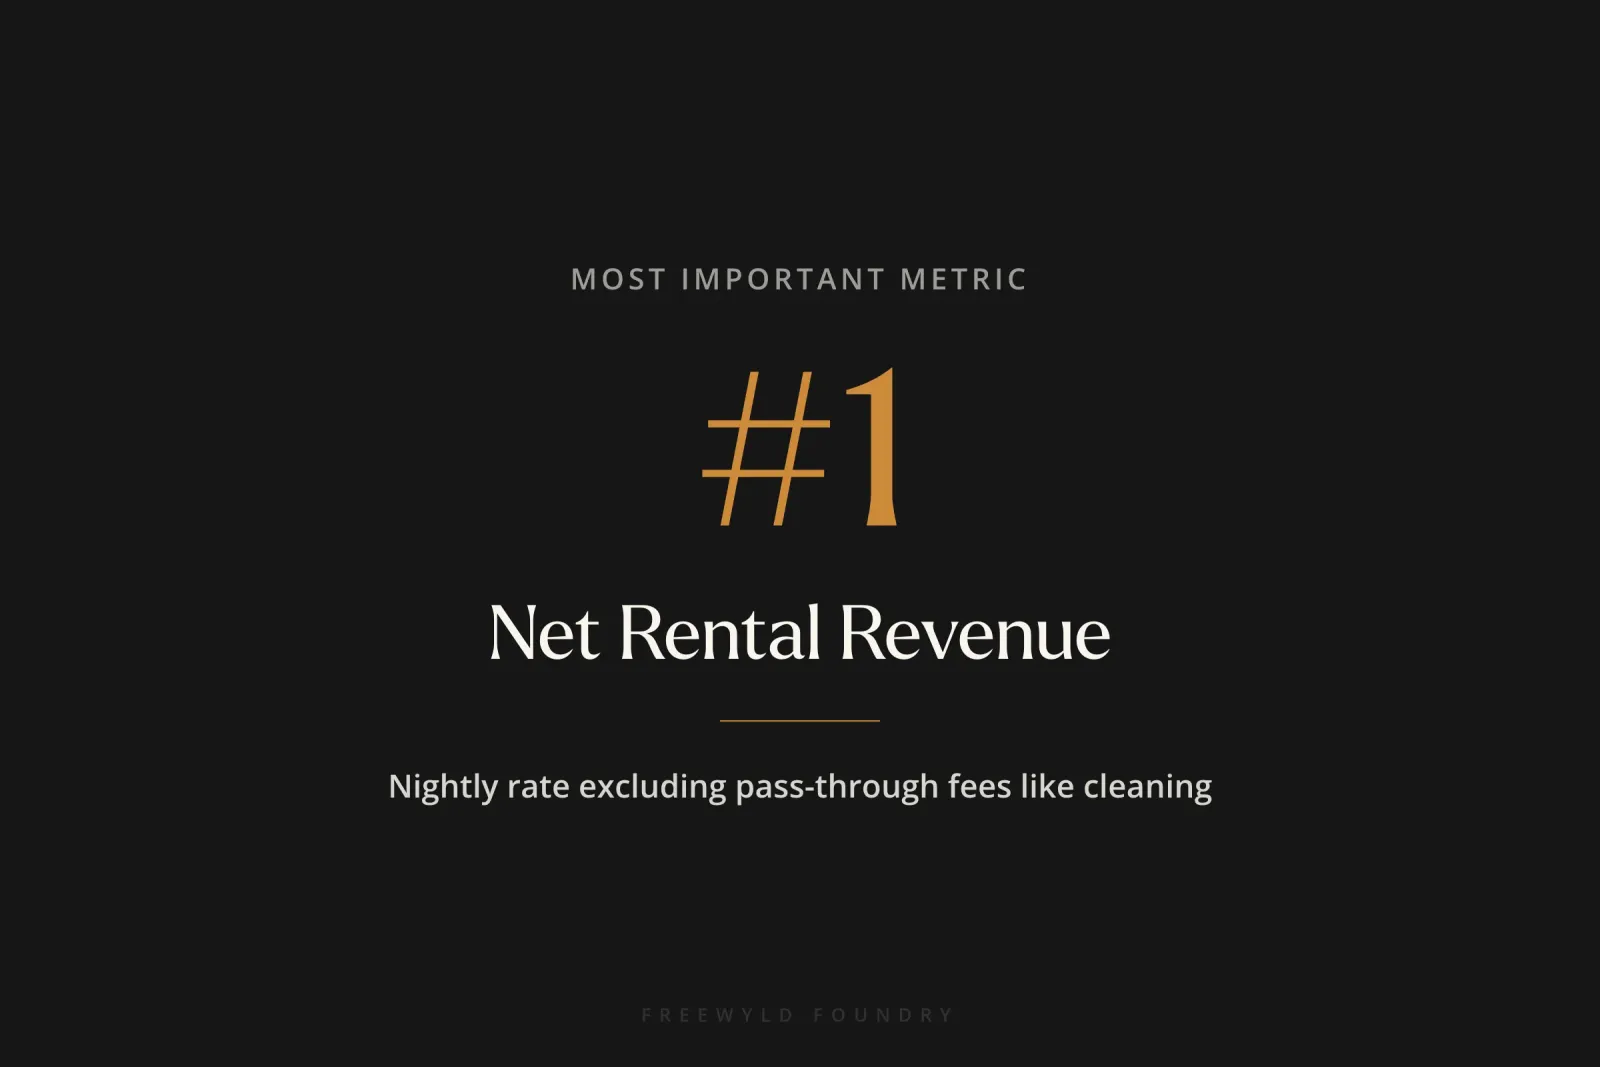
1. Net Rental Revenue (Most Important)
Net rental revenue is the nightly rate the guest pays, including extra guest fees but excluding pass-through fees like cleaning fees and pet fees.
This is a better indicator of actual performance than total revenue because cleaning fees are essentially pass-throughs. You receive the money but immediately pay it as an expense.
2. Occupancy Rate
The percentage of available nights that were booked. However, occupancy alone doesn’t tell the complete story.
3. Average Daily Rate (ADR)
The average nightly rate earned across all bookings. This helps you understand if you’re maintaining pricing power.
4. Revenue Per Available Room (RevPAR)
RevPAR is your total rental revenue divided by total available days. This metric accounts for calendar blocks and unavailable dates.
“Even though RevPAR takes into account available days in your calendar, you still want to exclude any properties that have a week or more as a block,” notes Ribbers. Calendar blocks longer than seven days reduce visibility and affect performance on remaining days.
Competitive Performance Metrics
5. Market Penetration Index (MPI)
MPI is your occupancy divided by market occupancy. If you’re at 40% occupancy and the market is at 50%, your MPI is 80% (or 0.8).
You want MPI to be at least 100% (matching market occupancy). Lower than that generally means you’re leaving revenue on the table.
6. RevPAR Index
Your RevPAR compared to the market RevPAR. Be careful with this metric because you need to adjust for property quality. If you have a budget unit and the market average includes luxury properties, a lower RevPAR Index doesn’t necessarily mean underperformance.
7. Market RevPAR Year-Over-Year Percentage
In PriceLabs, this KPI shows how similar listings in your area performed compared to last year. This is critical for adding market context to your performance, similar to how hotel revenue management compares performance against comp sets.
“If your portfolio is up 10% revenue, that sounds great. But if the market is up 20%, then you’re really lagging by roughly 10%,” explains Ribbers.
Forward-Looking Metrics
8. Booking Window
The average number of days between when a guest books and when they check in. This helps you understand pacing and optimize your pricing strategy timing.
9. Average Length of Stay
How many nights guests typically book. This affects your pricing strategy, particularly for minimum night stay requirements.
10. Bookable Nights
The number of nights available for booking. Track this year-over-year to ensure you’re making fair comparisons and not being misled by owner blocks or maintenance periods.
How to Compare STR Performance: The Three-Angle Framework
Looking at performance from only one angle gives an incomplete picture. You need three comparison perspectives:
Comparison 1: Year-Over-Year Performance
Compare this February to last February, this summer to last summer. This shows growth trajectory.
But remember to filter for comparable units only. New properties, properties with different availability, and properties with major anomalies should be excluded from this comparison.
Comparison 2: Month-to-Month Performance (Adjusted for Seasonality)
Compare January to February to March, but adjust for seasonal market changes.
If the market RevPAR was 50 in January and 60 in February, February was 20% stronger seasonally. If your February revenue was 30% higher than January, you outperformed the seasonal trend.
Comparison 3: Performance vs Market
The most critical comparison. You could beat last year’s numbers but still be failing if the market grew faster than you did.
Use market RevPAR year-over-year percentage to understand if you’re gaining or losing market share. This comparison is particularly important when avoiding common revenue management mistakes that operators make.
Real Example: When a 20% Decline Isn’t Actually Underperformance
Freewyld had a portfolio where every unit beat last year’s performance except one, which was down 20%. The client naturally asked: “What’s wrong with this unit?”
Investigation revealed that last year, someone booked the entire month three to four months in advance. When you book that far out, prices are higher because demand hasn’t materialized yet.
This was an anomaly that wouldn’t repeat every year. When we compared the unit to similar units in the portfolio and looked at month-over-month performance, the unit was actually performing well.
This is why you need multiple comparison angles. Looking only at year-over-year would have led to the wrong conclusion and potentially wrong corrective actions.
How to Track Market Performance for Your STR
Understanding market performance is essential, but how do you measure it?
Using PriceLabs Market Data
PriceLabs automatically creates a comp set of similar listings and provides a market RevPAR year-over-year percentage. This data is scraped from Airbnb and VRBO, so it’s not 100% accurate (the tool can’t distinguish between blocks and bookings), but it’s “fairly accurate for the most part,” according to Ribbers.
If you’re in a market with plenty of comparable inventory, these numbers should be sufficient for decision-making.
Creating Custom Comp Sets
You can build custom comp sets in the PriceLabs Market Dashboard to get more precise benchmarking. This is especially useful if the automatic comp set doesn’t match your property quality or location well enough.
Alternative Market Data Sources
AirDNA: Uses the same scraped data as PriceLabs, so you’ll likely find similar results.
KeyData: Provides real data from actual PMSs but only represents 15-25% of the market (their client base). This gives you accurate data for a subset of properties, typically the more professional segment of the market.
Both approaches have pros and cons. Scraped data covers more properties but has accuracy limitations. Real data is more accurate but covers fewer properties.
Common Mistakes to Avoid When Tracking STR Results
1. Tracking Total Revenue Instead of Net Rental Revenue
Total revenue includes cleaning fees, pet fees, and other pass-throughs that distort performance analysis. These fees should roughly equal your actual costs.
If you charge a $100 cleaning fee but your cleaning cost is only $50, you’re making $50 per booking. This favors shorter stays and complicates your pricing strategy unnecessarily.
“It’s always best to keep your pricing strategy as simple as possible because then it’s easier to understand and it’s easier to measure and it’s easier to see if there’s any concerns,” advises Ribbers.
2. Not Filtering for Comparable Units
Comparing all units year-over-year when you’ve added properties mid-year creates meaningless comparisons. You must separate new units from established units.
3. Ignoring Market Context
Celebrating 10% revenue growth without knowing the market grew 20% means you actually lost ground. Always adjust your performance against market benchmarks.
4. Not Accounting for Bookable Nights Differences
If a unit had an owner block last year that it doesn’t have this year, the revenue comparison is misleading. Track bookable nights year-over-year to ensure availability was similar.
5. Using RevPAR to Compare Properties with Extended Blocks
While RevPAR accounts for available days, blocks longer than seven days reduce visibility and booking performance on remaining days. Units with extended blocks aren’t truly comparable even with RevPAR.
How to Implement STR Performance Tracking Step by Step
Step 1: Set up monthly review calendar events at the beginning of each month to review the prior month’s performance.
Step 2: Pull individual listing performance data from your pricing tool (PriceLabs Leaderboard or custom reports work well).
Step 3: Create a spreadsheet or dashboard with two sections: “Comparable Units” and “Non-Comparable Units.”
Step 4: For each listing, determine if it’s comparable (12+ months data, similar bookable nights, no major anomalies).
Step 5: Calculate portfolio-level KPIs for comparable units only: occupancy, ADR, RevPAR, net rental revenue, MPI, RevPAR Index.
Step 6: Compare performance from three angles: vs last year, vs previous month (adjusted for seasonality), vs market.
Step 7: Identify listings that are underperforming and diagnose root cause (pricing, marketing, distribution, reviews, property condition). If you’re seeing consistent listing suspensions, that’s another factor to investigate.
Step 8: Identify listings that are overperforming and document what’s working differently. Consider if they’re implementing systems that scale better than other properties.
Step 9: Make data-driven adjustments to pricing strategy, marketing, or operations based on insights.
Step 10: Document decisions and results to build institutional knowledge over time.
Advanced: How to Track Multi-Unit Properties and Master Listings
If you rent individual units plus the entire building, tracking gets more complex.
Using PriceLabs Combined Listings Feature
Contact PriceLabs support to enable the “Combined Listings” feature (found under Manage Listings). This allows KPIs from a master listing to flow down into individual units.
For example, if someone books your entire four-cabin village, the revenue, occupancy, and other metrics flow down to each individual cabin’s KPIs. This makes the individual cabin KPIs more accurate and comparable.
Limitations with Multi-Level Master Units
If you have a building with eight units, plus first floor and second floor configurations, plus entire building bookings, PriceLabs can only combine one level. You’ll need a custom Excel or Google Sheets setup to properly track all configurations.
Frequently Asked Questions
How often should I review STR performance metrics?
Review performance monthly at minimum. Early in each month, analyze the prior month’s results for every listing. Some operators also do weekly pacing reviews to monitor forward-looking booking pace. Establishing a revenue management routine helps ensure consistency.
What is a good market penetration index for short-term rentals?
You want an MPI of at least 100%, meaning your occupancy matches the market average. An MPI below 100% generally means you’re leaving revenue on the table through either pricing that’s too high or insufficient marketing and distribution.
Should I track performance in my PMS or a pricing tool?
Pricing tools like PriceLabs provide better market comparison data and benchmarking features. PMSs show your raw data but typically lack market context. Use your pricing tool for performance analysis and your PMS for operational details.
How do I know if my property is underperforming or if the market is just down?
Compare your performance to the market RevPAR year-over-year percentage. If the market is down 10% and you’re down 10%, you’re maintaining market share. If the market is down 10% but you’re down 20%, you’re losing share and need to investigate why.
What is the difference between ADR and RevPAR in short-term rentals?
ADR (Average Daily Rate) is your average nightly rate across bookings only. RevPAR (Revenue Per Available Room) divides your revenue by all available days, including days you didn’t book. RevPAR is a better indicator of overall revenue management effectiveness because it accounts for occupancy.
How do I track short-term rental results when I’m constantly adding new properties?
Create separate reporting categories for “Comparable Units” (properties with at least 12 months of data and similar availability year-over-year) and “New Units” (everything else). Only use comparable units for year-over-year performance analysis. Track new units separately to understand their ramp-up performance.
What should I do if my revenue is up but my profit is down?
This often happens when cleaning fees and other pass-through costs increase without adjusting the fees you charge guests. Review your net rental revenue instead of total revenue. Also examine your cost structure, as rising operational costs may be outpacing revenue growth.
How does tracking performance help prevent revenue management mistakes?
Regular performance tracking allows you to spot problems early, like declining occupancy or ADR, before they become major issues. It also helps you identify which properties need attention and which strategies are working across your portfolio. Without tracking, you’re making changes blindly.
Conclusion
Tracking short-term rental results effectively is the foundation of real revenue management. Without a structured approach to measuring the right KPIs, comparing performance from multiple angles, and adjusting for market context, you’re making decisions based on guesswork rather than data.
The three-level system (individual listings, portfolio, comparable units only), combined with the three-angle comparison framework (vs last year, vs previous months, vs market), gives you the complete picture you need to make confident, profitable decisions.
Remember that net rental revenue is your North Star metric, not total revenue. Market context is mandatory, not optional. And comparable units require strict filtering or your year-over-year analysis becomes meaningless.
Start by implementing monthly reviews of your individual listings. Build your comparable units filter. And always, always check your performance against market benchmarks before drawing conclusions.
Understanding how to track short-term rental results is not optional for serious operators. It’s the difference between strategic growth and expensive guesswork.
Want expert help optimizing your revenue management strategy?
Get a free revenue report analyzing your portfolio’s performance with personalized recommendations.
Related Resources:
- Learn more about our revenue management service
- Master revenue management fundamentals with our self-serve course: Cashflow Mastery
- Listen to 700+ episodes of pricing and revenue strategy: Get Paid for Your Pad Podcast
Listen to the full conversation: Episode 706: How to Track Results - Rev Up Monday
About Jasper Ribbers: Jasper Ribbers is co-founder of Freewyld Foundry, where he oversees revenue and pricing strategy for 4,000+ short-term rental listings managing $190M+ in annual bookings. He co-hosts the Get Paid for Your Pad podcast and specializes in data-driven revenue management for high-performing STR operators. Connect with Jasper on LinkedIn.