
The July market update is in. The World Cup had less impact than expected, Airbnb just dropped a new discount every operator needs to understand, and there are moves you should be making right now for August.
In June, Freewyld Foundry drove $14.4 million in revenue across comparable client portfolios, a 22.36% increase year over year while broader markets averaged just 9% growth, most of that concentrated in World Cup host cities. Kansas City led at +44%, Dallas hit +40%, Miami +28%, and Philadelphia +20%. Everyone else? Mostly flat or slightly down, even with the biggest sporting event in history bringing 48 countries to US soil.
The takeaway on the World Cup: higher prices scared away regular travelers, and World Cup-specific demand wasn’t large enough to replace them. In most host cities, occupancy was actually lower than last year. The ADR bumped, but net revenue disappointed.
You will learn:
- Why markets only gained 9% during the World Cup and what that tells you about event pricing strategy
- Which cities outperformed and which disappointed, and the pattern behind it
- Why August weekdays are already softening and which weeks to reprice right now
- How extending the booking window is where most incremental revenue actually comes from
- Airbnb’s new 15% discount for top-rated guests: how it works, how it stacks, and how to think about turning it on
We also talk about:
- July pacing: Freewyld portfolios up 29.8%, broader markets up 5%
- The mobile-only discount reportedly rolling out in select Airbnb markets
- Why OTA discount strategy is becoming its own discipline within revenue management
- Why simply raising your Airbnb markup to offset the discount doesn’t work the way you think
Mentioned in the Episode:
- Freewyld Foundry Free Revenue Report
- Airbnb Top Rated Guest Discount (July 2026)
Subscribe for new episodes every Monday on YouTube, Spotify, and Apple Podcasts.

The STR Pacing Playbook
A step-by-step guide to tracking and using pacing data to optimize your short-term rental pricing strategy.
Download Free GuideContinue Listening
3 Ways to Get Good at Revenue Management
Revenue management is a specialty skill set. If you do not invest in learning it, you are leaving 10 to 40 percent of revenue on the table every year. Jasper breaks down the three pillars of actually getting good at it: experience, resources, and community.
25% YoY Growth and 1.4M Travel Points From His Mortgage: David Dodge on Building a STR Portfolio
David Dodge started with one beach house in Lincoln City, Oregon in 2021. Three years later his portfolio is up 25% year over year and he's earning 1.4 million travel points annually from his mortgage payments using BILT. He and Jasper break down exactly how both happened.

June STR Market Update: World Cup Impact and New Airbnb Discounts
The June market report is here. Freewyld's portfolios closed the month up 22.36% year over year, $14.4M in revenue across 75+ client properties, while the overall market averaged 9%. Jasper breaks down the gap market by market, covers what's coming in July, and explains a new Airbnb discount that just quietly launched.
Recording From the Netherlands
Welcome back to Get Paid for Your Pad. Today I'm recording from the Netherlands, where I'm staying at an Airbnb for a couple of months spending time with friends and family. And today I'm going to share the update for the month of July — what we've seen in our markets, how our portfolios have been performing, some things we noticed, and a brand new Airbnb feature that just came out.
Portfolio Results: 22% Year Over Year
First, as I do every month, I'm going to share exactly what the performance on the Freewyld portfolios was.
Of the 75 portfolios we currently manage — mostly in the United States and Canada, with some in Europe and Australia — comparable units were up 22.36% year over year. Total revenue generated for our clients was $14,425,000. Last year the result was $11,789,000. So we increased revenue by just over $2.5 million.
A quick reminder on comparables: we only look at units that were active last year, with no calendar blocks or outside factors that would skew the comparison. This gives you a real apples-to-apples picture. If you're running your own revenue management or working with a company, make sure you're always looking at comparable listings. Otherwise you don't get the full picture.
World Cup Market Analysis
On average, the markets we manage were up just over 9%. But there was a big discrepancy between markets, largely driven by the World Cup.
Cities where games happened generally saw higher ADR but lower occupancy. The higher prices scared away regular travelers while World Cup-specific demand didn't fill the gap. A few markets that outperformed:
- Dallas: up ~40% year over year
- Kansas City: up 44% — probably the strongest World Cup market we're in
- Miami: up 28%
- Philadelphia: up ~20%
Outside of those cities, most US markets were flat or slightly down. The Canadian markets were mixed — Halifax was strong, Calgary was down nearly 20%.
Markets being up 9% during the biggest sporting event in history is honestly disappointing. The World Cup brought 48 countries together and still barely moved the needle for most operators.
July Outlook and August Warning
As of right now, the markets we're in are up just over 5% year over year in July. Very modest. This year is shaping up to be similar to 2025 — not a lot of market growth to ride.
Our portfolios are currently pacing ahead by 29.8% in July. That number will likely come down a bit as the month closes out. But we'll have the final numbers in next month's update.
One thing to act on now: August weekdays. Schools in many states go back in the second and third week of August. If you have a seasonal profile set for Memorial Day through Labor Day, check it. The weekday demand inside that range drops significantly once kids are back in school. Look at your August calendar right now and make sure your weekdays are priced competitively for that last stretch.
The Booking Window Advantage
A big reason our portfolios are pacing so far ahead is that we extend the booking window for our clients. A lot of operators focus entirely on last-minute pricing and ignore the early part of the window — the dates six, nine months out.
People booking far in advance for events like Christmas, Thanksgiving, and New Year's are often willing to pay a premium. But if you're not paying attention and your prices are too high, you're pricing yourself out before you ever had a chance.
Last-minute pricing is easy. Everybody can manage the last two weeks. But managing the entire booking window — making sure you're competitive and not overpriced throughout — is where most of the additional revenue comes from when we take on a new portfolio.
Airbnb's New 15% Discount for Top-Rated Guests
Airbnb just introduced a new discount for guests with a 4.8+ rating and at least three reviews. The discount is fixed at 15% — you can't change it, it's either on or off.
To find it: go to your calendar, select an individual listing, click Discounts on the right side. You'll see weekly discount, monthly discount, and then a new section called Top Rated Guests.
In return for enabling the discount, Airbnb says you get more visibility in search results and a special badge. The badge shows in search — I couldn't find it on the listing page itself yet, but it's likely appearing in results.
A few things to know:
This discount stacks. It stacks with early bird discounts, length of stay discounts, weekly discounts, and the mobile-only discount that's reportedly rolling out in some markets. Before you turn it on, understand how the stacking affects your net price.
You can't be price-neutral by simply raising your Airbnb markup 15%. If you raise your price 15% and then give 15% off, you're actually discounting more than 15% of your original price. You'd need to raise by about 18% to break even — and now all the guests without the top-rated status are paying 18% more than before.
Generally, when Airbnb wants hosts to do something, there's usually a visibility benefit worth taking seriously. My initial thinking is to partially raise the markup — not the full 18%, maybe 5-10% — so that experienced guests get a real discount while you capture some upside from everyone else. We're still working through the full strategy internally and I'll give an update next month.
Mobile-Only Discount
There are also reports that Airbnb has rolled out a mobile-only discount in select markets — similar to Booking.com's mobile-only 10% deal. I haven't seen it in my account yet, but keep an eye out. If it stacks with the top-rated guest discount and length of stay discounts, OTA discount strategy is getting meaningfully more complex.
OTA Discount Strategy Is Becoming a Discipline
If you're listed on Airbnb, VRBO, and Booking.com, you now need a specific strategy for each platform — not just the prices you put in PriceLabs or Wheelhouse, but what promotions and discounts you're activating and how they interact.
I'll probably do a dedicated episode on OTA discounting in the next few months because it's getting complicated enough to warrant it.
Wrapping Up
That's the July update. If you want to know how your portfolio stacks up, you can get a free revenue audit at freewyldfoundry.com/get-started. We'll show you exactly where we think you can improve. If it's a win-win, we'll let you know how we can work together.
Thanks for listening. See you next week.
Related Articles
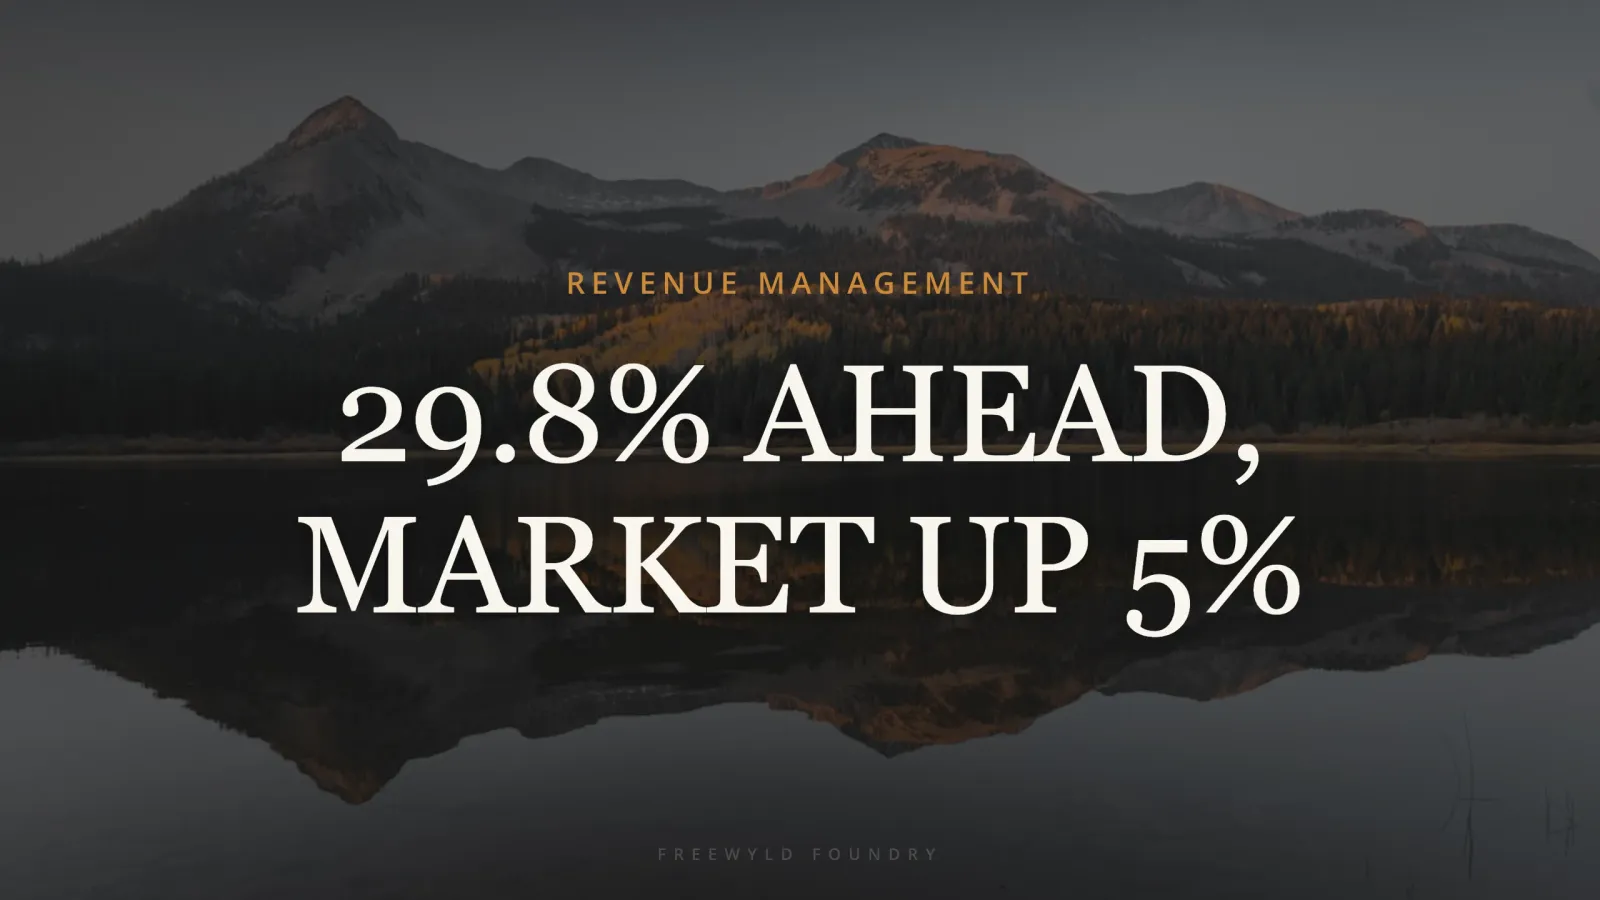
STR Market Update July 2026: Freewyld at 29.8%, the Airbnb Discount Decision, and What to Fix Before August Ends
Freewyld portfolios are pacing 29.8% ahead in July while the broader market sits at 5%. Here is what is driving the gap, what the Airbnb top-rated guest discount actually means for your pricing, and the August weekday problem most operators are about to walk into.
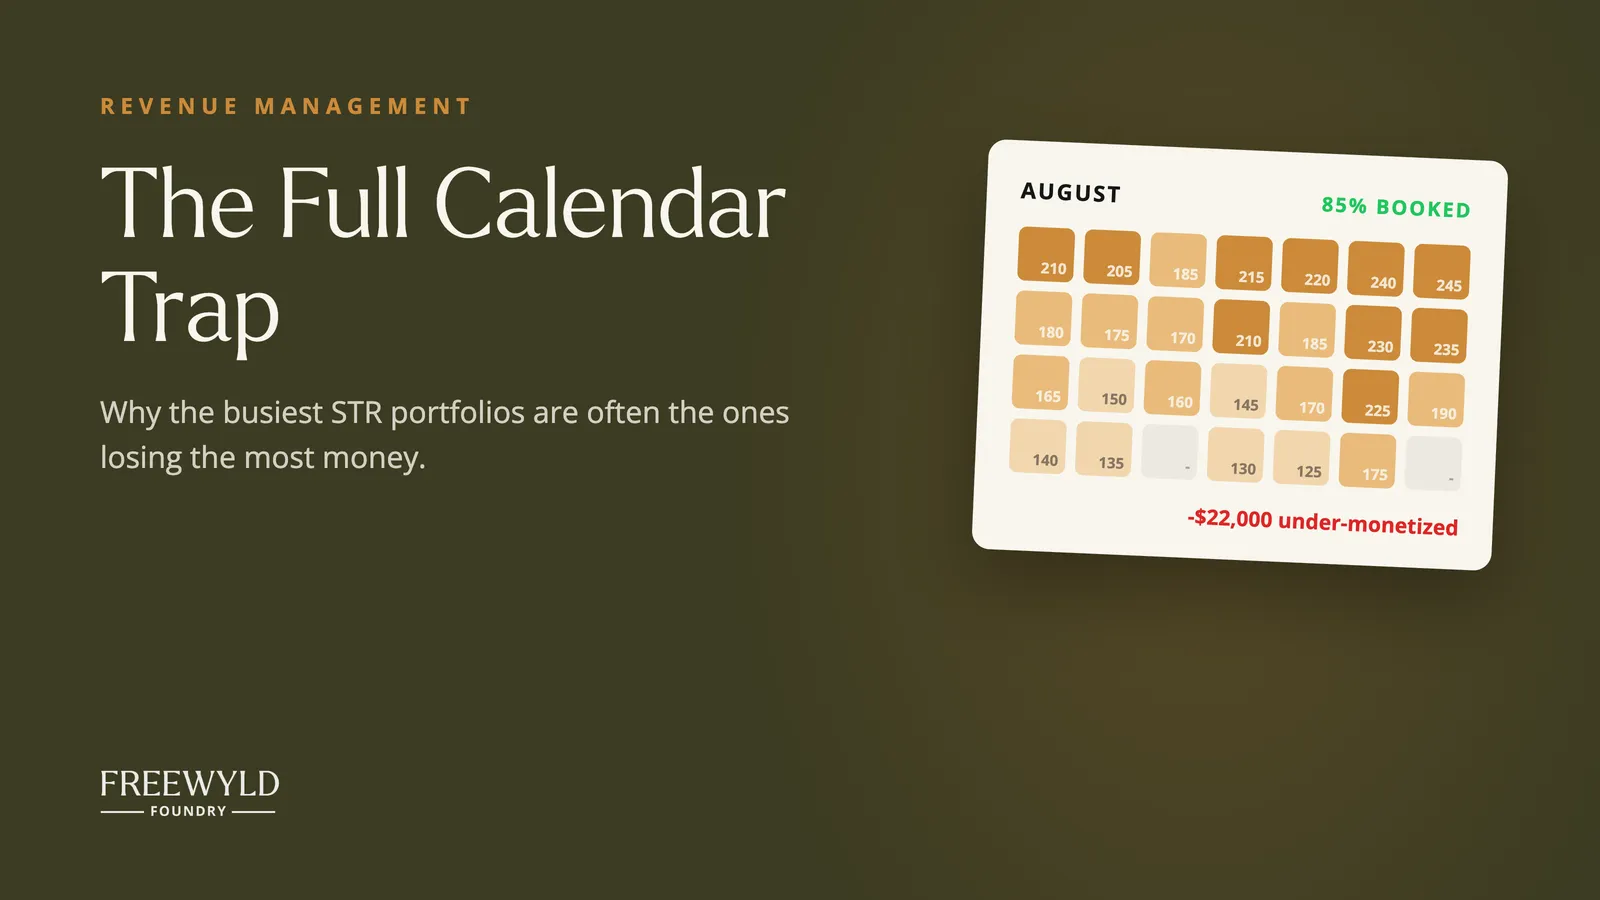
The Full Calendar Trap: Why the Busiest STR Portfolios Are Often the Ones Losing the Most Money
85% occupancy, great reviews, and a pricing tool on autopilot. It looked like a healthy business. It was leaking $22,000 a month.

How to Learn Revenue Management: 3 Pillars Every STR Operator Needs
Revenue management is a specialty skill set that can make or break your short-term rental business. Most operators either avoid learning it or learn from the wrong sources. Here is the framework that actually works.